Dear visitor
You tried to access but this page is only available for
You tried to access but this page is only available for


Witold Bahrke
Senior Macro and Allocation Strategist
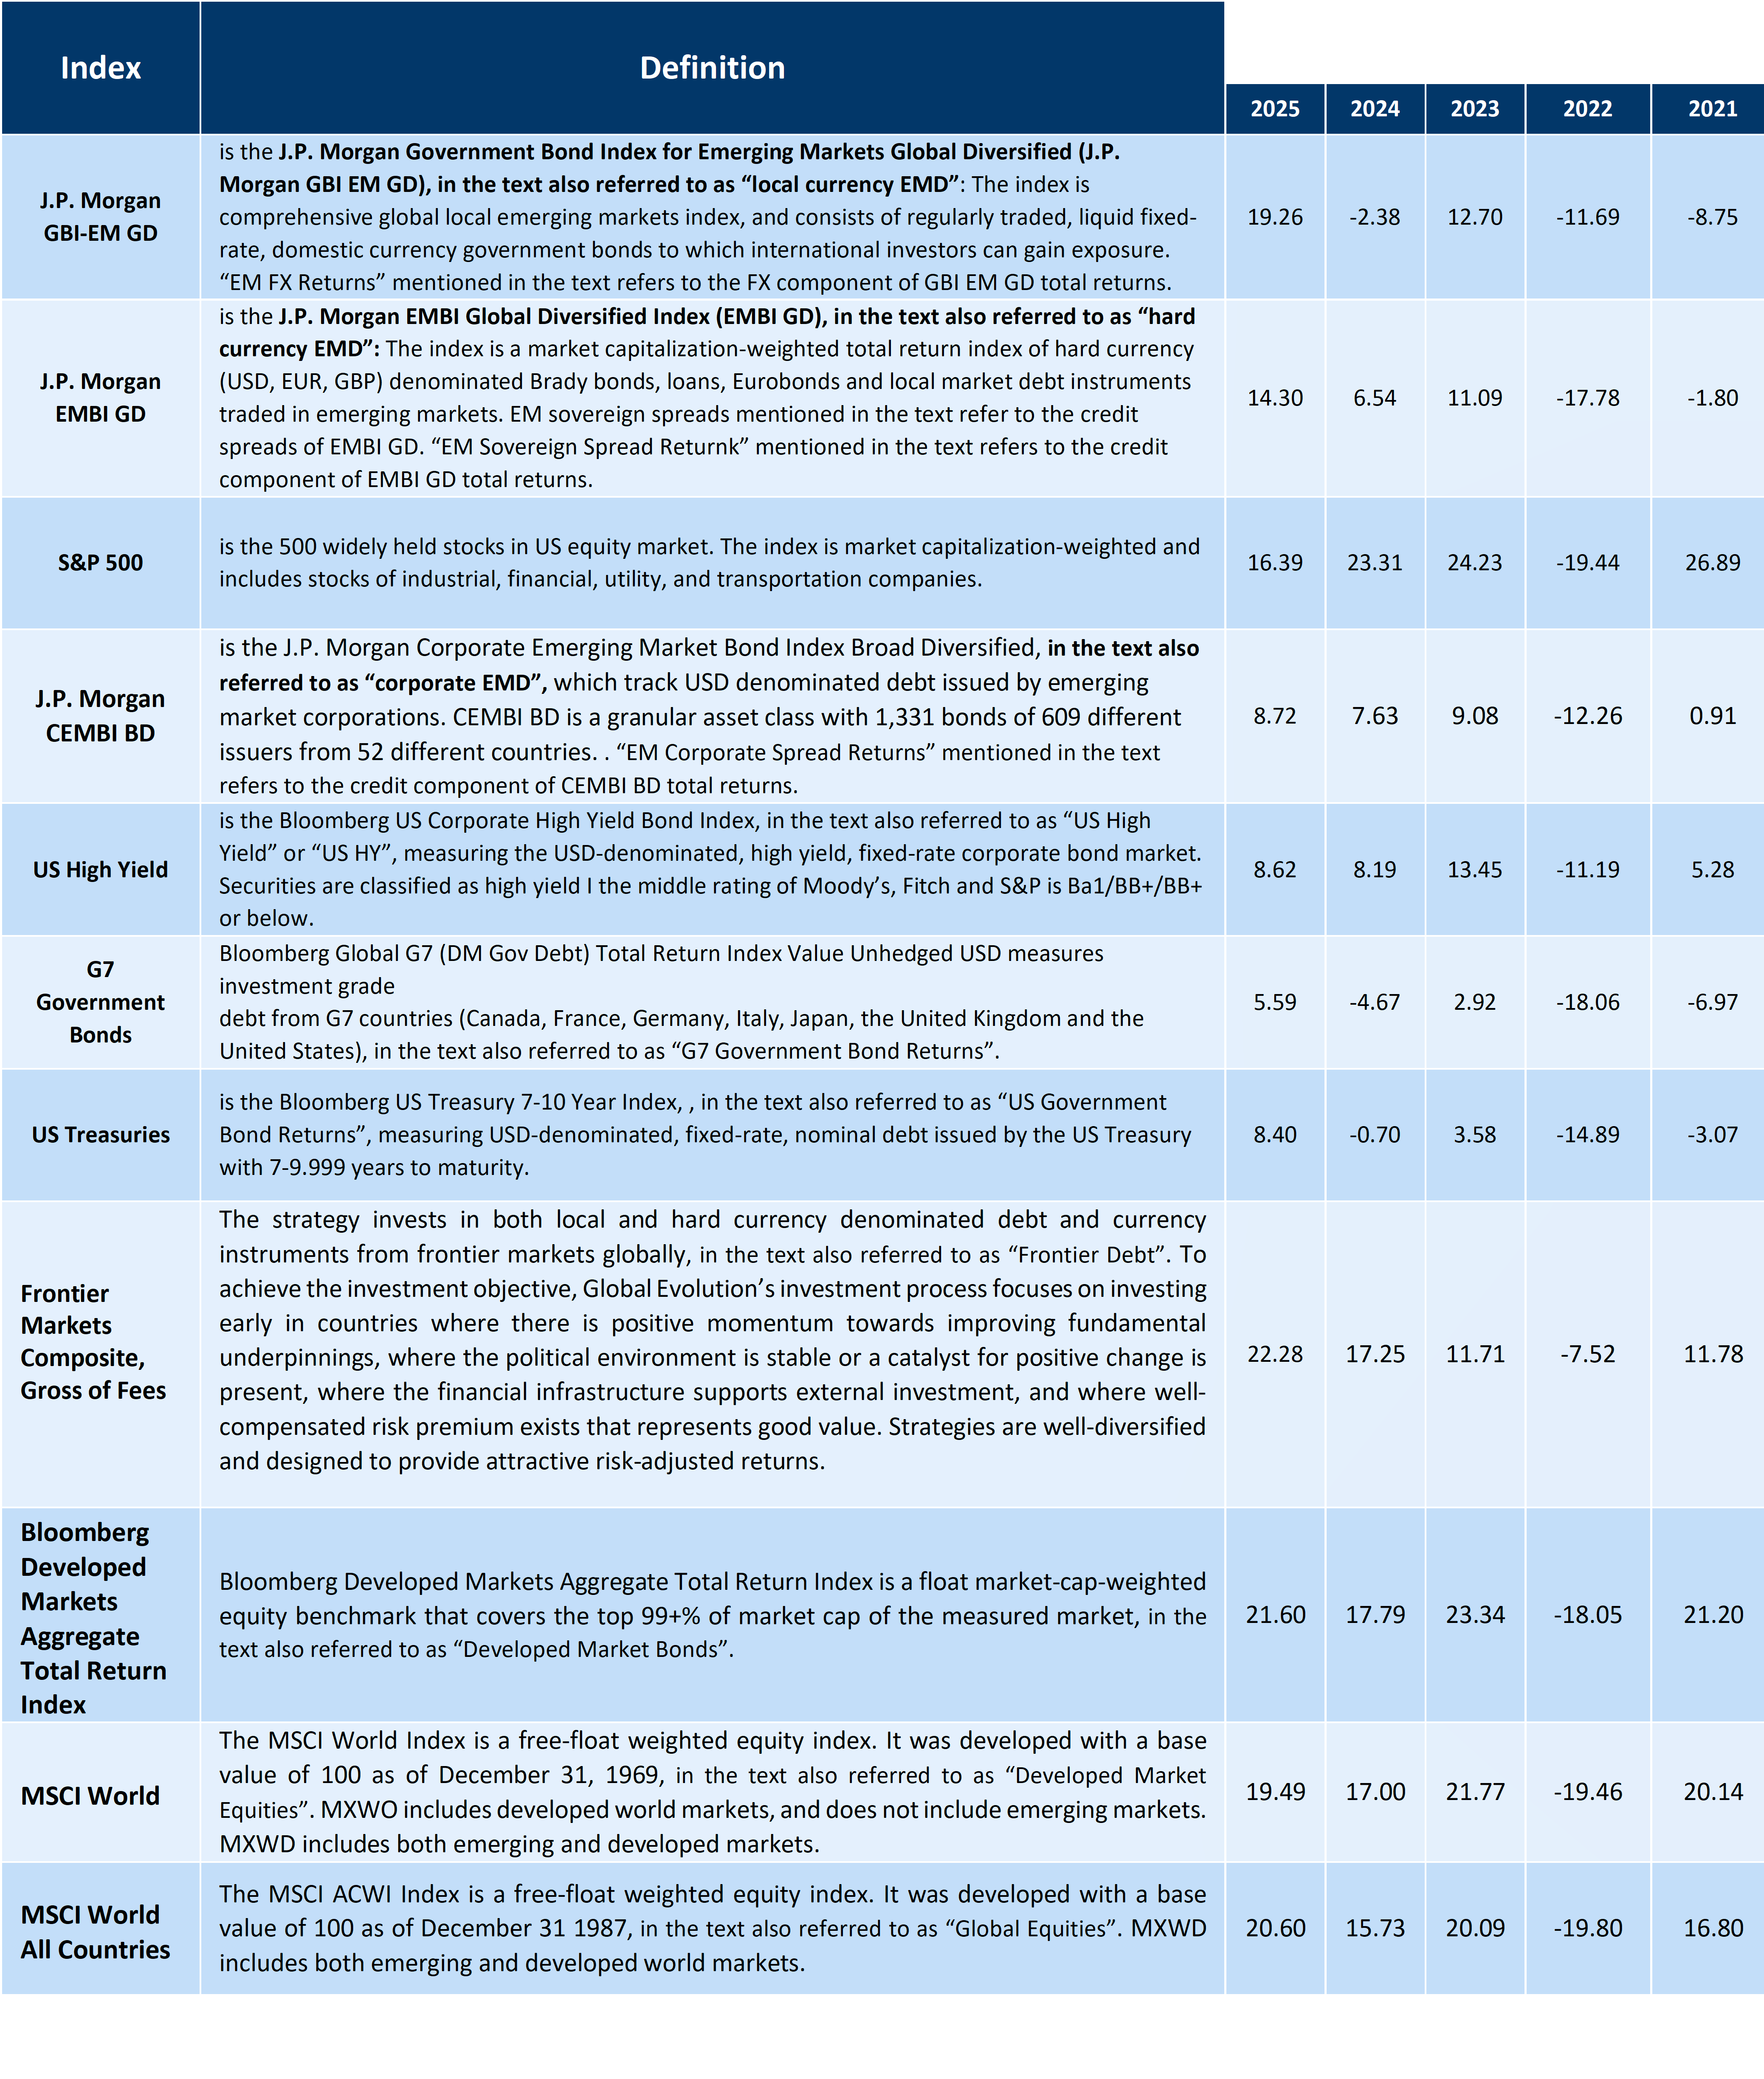
2025 proved to be the best year for Emerging Market debt (EMD) since 2012[1]. Downbeat sentiment towards the asset class and geopolitical fears lowered the bar for positive surprises. This proved to be an excellent starting point for EMD investors, particularly in the local currency space. A powerful cocktail of a resilient economy, easing monetary conditions and high, but declining geopolitical uncertainty led to an 11-year low in EM sovereign debt spreads and the best year for EM currencies since 2009.
Fast forward to today, overall sentiment as well as sentiment towards EM assets is almost the mirror image of what it was as year ago. After a stellar 2025, the market mood is bulled-up. The consensus has all but fallen in love with EM as the global business cycle remains steadfast. 2025 marked the first year of EMD inflows after 3 consecutive years of outflows.
The business cycle: Fiscal first
Now what? From an economic perspective, the good news is that the business cycle should continue largely unabated. In fact, we see upside risk to the consensus 2026 world GDP forecast, which currently stands at 3% Y/Y according to Bloomberg.
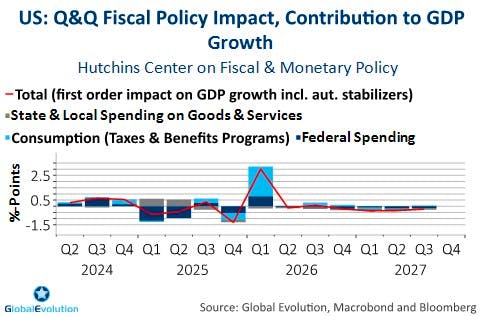
First, fiscal policy in the US (see chart 1) is set to be more stimulative than last year. The “one big beautiful bill act” is set to lift GDP growth by up to 3% annualized in the first quarter as deficit spending is frontloaded, while spending cuts are backloaded. Germany’s fiscal spending package is set to kick in the second half, delivering a fiscal impulse of about 1% on a national level. In Japan, things are not set in stone, yet but the new prime minister Takaichi also seems on course for more fiscal stimulus. China might be the biggest question mark at the time of writing. An economy firing on one (export) cylinder amid lackluster domestic demand makes a renewed fiscal stimulus push likely as the year progresses. Although the fiscal impulse in 2026 is expected to be driven out of DM, it should spill over to EM countries, as well.
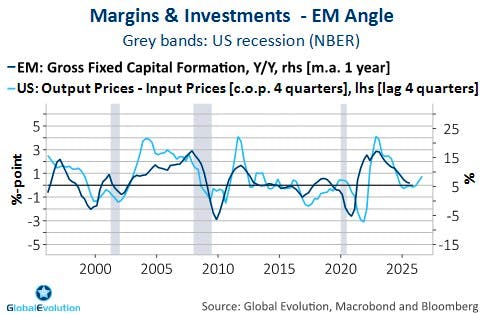
Secondly, investment spending – traditionally one of the main swing factors of the business cycle - is expected to broaden beyond AI related capex spending in the US. Strong productivity growth is supporting corporate profits, keeping unit labour costs low. At the same time, companies’ output prices are rising at a healthy clip, resulting in solid margins notwithstanding US tariffs. Wider margins and sturdy profit growth tend to lead investment activity higher. On top, the deregulatory push from the White House serves as an additional incentive to ramp up investment spending this year. Unsurprisingly, US business surveys already hint at rising appetite to spend on capex.
These developments are difficult to track in the EM universe due to more limited data availability. However, chart 2 indicates that whenever improving margins support the DM profit cycle, thereby resulting in upside risk to investment spending, it also tends to lead the EM investment cycle higher. At the current juncture, the drivers behind higher DM margins suggest that the EM investment cycle is about to inflect higher after several years of trending lower.
Third, global trade has not only dodged the tariff bullet in so far as both EM and DM export growth has held steady. Leading trade indicators are indicating EM export acceleration over the coming months. This is partly a result of trade rerouting with the aim of lowering tariff costs. But it also reflects declining trade policy uncertainty as well as robust DM growth demand.
Lastly, loose financial conditions and the lagged impact of the rate cutting cycle in EM as well as DM are supporting growth, adding to the upside risks to global GDP growth in 2026.
Shifting balance of power
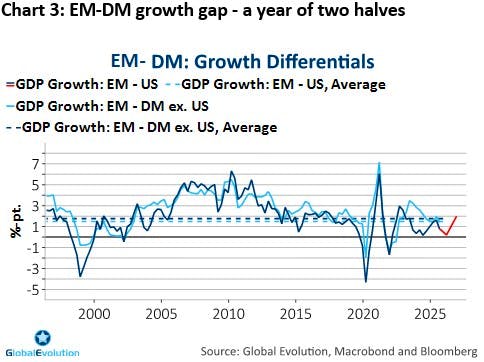
From an EM perspective, it does not only matter what overall global GDP growth is doing in 2026. The composition of growth matters, as well. Here, 2026 will look somewhat different relative to 2025. For much of last year, the gap between EM and US growth moved in EM’s favour (chart 3). Beyond the pure growth aspect, this also played in the hands of EM’s as it was a key explanation behind the US Dollars descent and therefore a key contributor to easing monetary conditions.
In 2026, the picture looks more fractured. Primarily due to the strong fiscal impulse out of the US in the first part of this year and China’s fiscal impulse kicking in later in the year, we expect the growth gap between EM and the US tighten in the beginning of 2026. In the second half, however, the US fiscal impulse will fade somewhat and the growth gap between EM and DM should move in EM’s favour, as highlighted by the red line in Chart 3. The changing trajectory has important implications for monetary conditions in 2026.
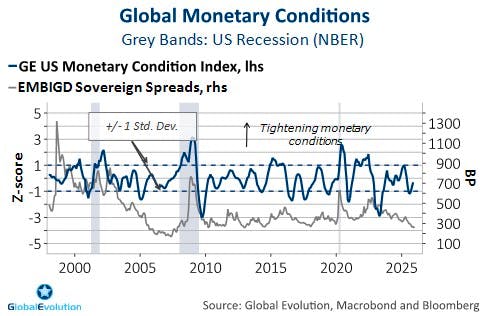
Besides the growth compositions, the monetary backdrop differs from last year. Last year, slowing inflation allowed for central bank cuts across EM and DM, contributing to substantial USD weakness. Monetary conditions eased meaningfully, as our monetary conditions index (chart 4) illustrates.
But as so often in the world of economics and finance, there is no such thing as free lunch. The flipside of a surprisingly resilient global economy are moderating monetary tailwinds in 2026. The global rate-cutting cycle has already slowed substantially as both EM and DM inflation seem to level off above most central banks’ targets. Crucially, we believe the world’s most important central bank, the Fed, to potentially cut less than expected by market participants in 2026. In addition, US exceptionalism might face a bit of a revival in the beginning of 2026, causing the Greenback to recover some ground early in the year. Dollar strength in itself adds to the net-tightening of monetary conditions in 2026.
The upshot here is that the balance of power between fiscal and monetary stimulus is shifting away from the monetary side and towards fiscal policy. From a growth perspective, this might not make a big deal. However, from a market perspective, monetary stimulus is the preferred option as fiscal stimulus can have quite detrimental effects on the balance between real growth and inflation.
The main scenario here is one of sideways inflation dynamics. But amid the shifting balance of power between fiscal and monetary stimulus, it might not come as surprise that the biggest downside risk arises from stagflation. If strong productivity growth fails to extend into 2026, the fiscal impulse collides with supply constraints in the labour market could quickly result in accelerating wage growth. Inflation and interest rates would break out of recent ranges, causing monetary conditions to tighten. Such an end-cycle boom scenario would ultimately result in a bust, causing the business cycle to roll over. Due to the substantial amount of DM fiscal stimulus already in the pipeline (see above), such a stagflationary boom/bust tail risk scenario has a higher probability than an outright disinflationary recession, in our view.
The market cycle: Not so fast
In the grand scheme things, the economic outlook for 2026 seems like a continuation of last year’s trajectory. The business cycle rumbles on and could even accelerate in the near-term. That said, the implication of a changing growth and stimulus composition is that the market cycle is set to slow. Further, it is our belief its overall trajectory might differ somewhat in the first half of 2026 as compared to much of last year. Here's why.
On the one hand, resilient growth and sound fundamentals should keep EM credit spreads tight, safeguarding solid returns for the whole year. However, a growth balance shifting in favour of DM in the first half of 2026 and reduced monetary easing implies a trickier macro backdrop. Although these headwinds are set to abate in the second half of 2026 as the EM-DM growth gap re-widens, it should result in lower returns this year compared to 2025. Granted, fiscal stimulus might compensate for more moderating monetary tailwinds from a growth perspective. But fiscal stimulus also deteriorates the trade-off between growth and inflation, which is why crowding out is a real risk.
Secondly, after strong EMD returns in 2025, sentiment appears stretched. In fact, the situation today appears like the exact opposite of the skepticism towards the asset class dominating 12 months ago. Heading into 2025, very few investors wanted to touch EMD due to the regime shift in Washington. 1 year into Trump’s second presidential period, everyone seems to have fallen in love with the asset class. Consequently, the bar for positive surprises is much higher than a year ago. Together with lofty valuations and reduced monetary easing this results in elevated setback risks over the tactical horizon – both in the shape of EMFX depreciation and EM spread widening (see chart 5). Hence, the market cycle could turn out to be more vulnerable in the near-term than the business cycle resilience would suggest.
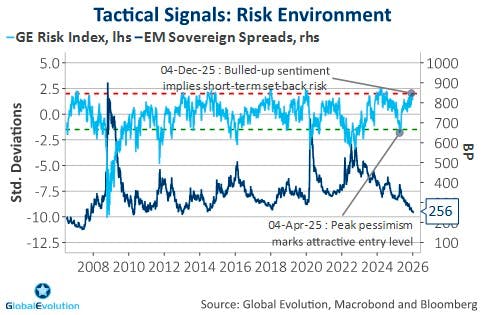
Amid sound fundamentals and business cycle resilience, the tactical stumbling blocks mentioned above don’t suffice to derail the market cycle, ultimately leading to attractive entry points compared to today’s levels. Nevertheless, investors should brace for a wobbly start to 2026 and more moderate overall returns in 2026 as compared to last year. Be prepared for more bouts of volatility, especially early into the year. Consequently, we enter 2026 with a cautious stance on overall EMD risk exposure.
As the market cycle should prove less stable than the business cycle, it almost goes without saying that EMD asset allocation will not be a one-way street in 2026. We expect the trajectory of EM FX to largely resemble the trajectory of the EM-DM growth differential. Contrary to the current consensus, this means that EM FX should face headwinds at the beginning of 2026. The market’s pricing of Fed’s rate path implies two rate cuts this year, which seems out of sync with a robust growth outlook and sticky inflation. Hence, the cross-Atlantic interest rate differential should move in favour of the Dollar over the coming months. Lastly, elevated sentiment readings shown in chart 5 normally also preempt EM FX depreciation risk. Contrary to 2025, we are therefore entering this year with a preference for hard currency debt over local currency debt.
Asset allocation: Be nimble
As 2026 progresses, local currency debt should regain the upper hand in terms of relative performance. The EM – DM growth differential should widen again, supporting EM currencies. US fiscal stimulus will fade, while China is likely to ramp up its stimulus efforts amid a dearth of domestic demand. In addition, Fed rate cutting probabilities are set to increase anew in H2 as the inflationary impact of tariffs is fading and growth slows. In addition, EM currency exposure still is the preferred way to benefit from EM’s macro outperformance over recent years. Namely, the structural shifts towards higher inflation, higher geopolitical uncertainty as well as higher fiscal deficits are all DM-centric in nature. EM’s outperformance within these areas should continue to benefit EM FX, in particular, improving the risk-reward of local currency EMD (for more details, see here).
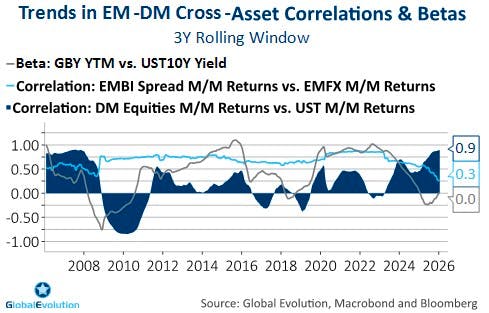
An important consequence of the structural shifts mentioned above is that market cycles have become shorter, emphasizing the importance of an active asset allocation approach to EMD investing. The good news is that EMD offers plenty of opportunities to diversify and to improve risk-adjusted returns through active allocation between main EMD segments. To a large part, this is reflecting a tightening inflation gap between EM and DM. Diversification opportunities within DM, on the other hand, are becoming scarce as the trade-off between growth and inflation is deteriorating in the DM universe. As chart 6 shows, the correlations between EMD risk premiums – credit risk and FX risk – has declined to the lowest levels since 2003. At the same time, the rolling beta between US yields and EM yields has declined to the lowest levels since 2009. Correlations between the main DM asset classes, on the other hand, have risen.
While we believe there may be high-single digit EMD returns for the whole year, the market cycle appears vulnerable in the short term. As opposed to 2025, where local currency debt outperformed almost throughout the year, the picture for this year looks much more nuanced. 2026 should turn out to be a brilliant example of the potential improvement of risk/returns emanating from an active asset allocation approach within EMD segments as well as between EMD and DM debt, described in-depth here. Be nimble.
[1] Based on the average return of hard currency EMD, local currency EMD & corporate EMD, see Appendix 1
Disclaimer & Important Disclosures
Global Evolution Asset Management A/S (“Global Evolution DK”) is incorporated in Denmark and authorized and regulated by the Finanstilsynet of Denmark (the “Danish FSA”). Global Evolution DK is located at Buen 11, 2nd Floor, Kolding 6000, Denmark.
Global Evolution DK has a United Kingdom branch (“Global Evolution Asset Management A/S (London Branch)”) located at Level 8, 24 Monument Street, London, EC3R 8AJ, United Kingdom. This branch is authorized and regulated by the Financial Conduct Authority under the Firm Reference Number 954331.
In the United States, investment advisory services are offered through Global Evolution USA, LLC (‘Global Evolution USA”), an SEC registered investment advisor. Registration with the SEC does not infer any specific qualifications Global Evolution USA is located at: 250 Park Avenue, 15th floor, New York, NY. Global Evolution USA is an wholly-owned subsidiary of Global Evolution Asset Management A/S (“Global Evolution DK”). Global Evolution DK is exempt from SEC registration as a “participating affiliate” of Global Evolution USA as that term is used in relief granted by the staff of the SEC allowing U.S. registered investment advisers to use investment advisory resources of non-U.S. investment adviser affiliates subject to the regulatory supervision of the U.S. registered investment adviser. Registration with the SEC does not imply any level of skill or expertise. Prior to making any investment, an investor should read all disclosure and other documents associated with such investment including Global Evolution’s Form ADV which can be found at https://adviserinfo.sec.gov.
In Singapore, Global Evolution Fund Management Singapore Pte. Ltd has a Capital Markets Services license issued by the Monetary Authority of Singapore for fund management activities. It is located at Level 39, Marina Bay Financial Centre Tower 2, 10 Marina Boulevard, Singapore 018983.
Global Evolution is affiliated with Conning, Inc., Goodwin Capital Advisers, Inc., Conning Investment Products, Inc., a FINRA-registered broker dealer, Conning Asset Management Limited, Conning Asia Pacific Limited and Octagon Credit Investors, LLC are all direct or indirect subsidiaries of Conning Holdings Limited (collectively, “Conning”) which is one of the family of companies owned by Cathay Financial Holding Co., Ltd., a Taiwan-based company. Conning has offices in Boston, Cologne, Hartford, Hong Kong, London, New York, and Tokyo.
Conning, Inc., Conning Investment Products, Inc., Goodwin Capital Advisers, Inc., Octagon Credit Investors, LLC, are registered with the Securities and Exchange Commission (“SEC”) under the Investment Advisers Act of 1940 and have noticed other jurisdictions they are conducting securities advisory business when required by law. In any other jurisdictions where they have not provided notice and are not exempt or excluded from those laws, they cannot transact business as an investment adviser and may not be able to respond to individual inquiries if the response could potentially lead to a transaction in securities. Conning, Inc. is also registered with the National Futures Association and Korea’s Financial Services Commission. Conning Investment Products, Inc. is also registered with the Ontario Securities Commission. Conning Asset Management Limited is authorised and regulated by the United Kingdom's Financial Conduct Authority (FCA#189316), Conning Asia Pacific Limited is regulated by Hong Kong’s Securities and Futures Commission for Types 1, 4 and 9 regulated activities
This publication is for informational purposes and is not intended as an offer to purchase any security. Nothing contained in this website constitutes or forms part of any offer to sell or buy an investment, or any solicitation of such an offer in any jurisdiction in which such offer or solicitation would be unlawful.
All investments entail risk and you could lose all or a substantial amount of your investment. Past performance is not indicative of future results which may differ materially from past performance. The strategies presented herein invest in foreign securities which involve volatility and political, economic and currency risks and differences in accounting methods. These risks are greater for investments in emerging and frontier markets. Derivatives may involve certain costs and risks such as liquidity, interest rate, market and credit.
This communication may contain Index data from J.P. Morgan or data derived from such Index data. Index data information has been obtained from sources believed to be reliable but J.P. Morgan does not warrant its completeness or accuracy. The Index is used with permission. The Index may not be copied, used, or distributed without J.P. Morgan's prior written approval. Copyright 2025, J.P. Morgan Chase & Co. All rights reserved.
While reasonable care has been taken to ensure that the information herein is factually correct, Global Evolution makes no representation or guarantee as to its accuracy or completeness. The information herein is subject to change without notice. Certain information contained herein has been provided by third party sources which are believed to be reliable, but accuracy and completeness cannot be guaranteed. Global Evolution does not guarantee the accuracy of information obtained from third party/other sources.
The information herein is not intended to provide, and should not be relied upon for, accounting, legal or tax advice or investment recommendations. This document does not constitute investment advice. The contents of this document represent Global Evolution's general views on certain matters, and is not based upon, and does not consider, the specific circumstance of any investor.
Legal Disclaimer ©2026 Global Evolution.
This document is copyrighted with all rights reserved. No part of this document may be distributed, reproduced, transcribed, transmitted, stored in an electronic retrieval system, or translated into any language in any form by any means without the prior written permission of Global Evolution, as applicable.
Copyright © 2026 Global Evolution - All rights reserved