Dear visitor
You tried to access but this page is only available for
You tried to access but this page is only available for

Witold Bahrke
Senior Macro and Allocation Strategist
Geopolitical regime shift
The only certainty is uncertainty – in times of spiraling geopolitical risks, the old adage is more true than ever. Year-to-date, measures of policy uncertainty have leaped higher, culminating with the tariff barrage announced by the White House on April 2nd. Especially in a global trade context, the world economy has entered the most disruptive phase in recent history as the US no longer serves as an anchor for a rule-based global trading system.
In our previous piece, we highlighted some of the economic consequences of rising geopolitical uncertainty, namely peak US exceptionalism (see here). This report sheds some light on the role of EM debt (EMD) as such in a world of lingering geopolitical uncertainty. The overarching question is how investors should navigate through a market environment shaped by geopolitically induced volatility.
Relative resilient EMD – fluke or feature?
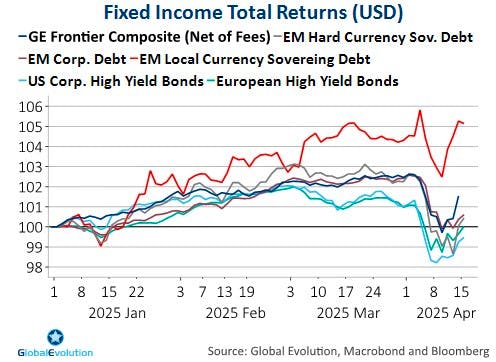
Let’s take stock of recent market developments first. Year-to-date, Emerging Market bonds have not been unscathed by rising geopolitical uncertainty, but total returns are still mostly positive. Contrary to what many observers might have expected, the asset class has held up better than riskier DM bond peers such as US high yield (see chart 1). The best-performing segments are those often perceived as representing the riskier part of the EMD spectrum. For instance, local currency EM sovereign bonds have outperformed within EMD year-to-date, defying negative consensus expectations at the beginning of the year[1].
Is the resilience of EM debt a fluke or could it continue? The answer to this question is highly dependent on what geopolitical regime lies ahead. For some time, our core thesis has been that geopolitical uncertainty will remain elevated, but not become unanchored.
In order to be proven right, geopolitical uncertainty should mean revert to levels above average but below current highs[2], (blue range in chart 2 below).

Base case: Peak uncertainty…
At the current juncture, such mean reversion might seem like a brave prophecy. The US tariff blitz announced on April 2nd – the so-called “liberation day” - questions any hopes of such a mean reversion to high, but not too high levels of policy uncertainty. What makes us confident that uncertainty is close to a peak rather than getting un-anchored?
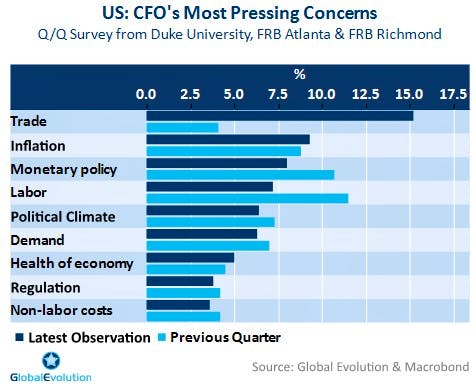
First and foremost, we find it hard to believe that Washington is willing to accept the economic pain that follows from an effective tariff rate staying around 25%. A recession would be all but certain under such a tariff burden. Already before the so-called reciprocal tariffs announced on April 2nd, trade has been catapulted to the top of the list over the most pressing concern among US CFOs (see chart 3 below).
Plunging consumer confidence surveys send the same message: Any euphoria or animal spirit on the back of Trump’s election victory has evaporated, with concerns around trade and tariffs being the primary driver. Granted, real economic data has held up well so far. But the longer policy uncertainty lasts, the more likely it becomes that weak confidence will pull the real economy down, as well. The 90-day moratorium on most of the reciprocal tariffs announced only 1 week after “liberation day” reveals a lot about the White House reaction function. The US administration is seemingly unwilling to accept a recessionary outcome and might already have “blinked”. Consequently, a policy put is in play, limiting the potential fall-out from trade policy.
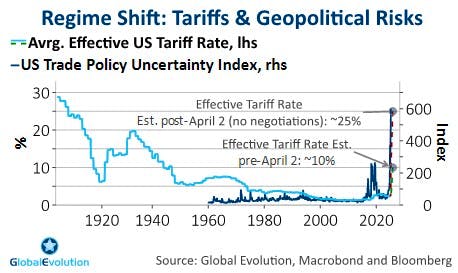
Secondly, tariffs should primarily serve as a negotiation tool. While the White House emphasized the revenue-raising feature of tariffs, it has also repeatedly hinted at a path towards trade negotiations. In the same vein, US Treasury Secretary Bessent described the initial tariff announced on April 2 as a ceiling, with the floor still to be determined. Our best guess is that the recession threshold of the effective tariff rate in the US is not too far from 20%[3]. This is meaningfully below the 25% rate implied by the announcements on April 2 (see chart 4). Based on what learned about Washington’s reaction function so far, the base case is that the US effective tariff rate end up below 20% and the US skirts a recession.
However, using tariffs as a negotiation tool implies that uncertainty will linger – it’s part of the plan in order to maintain a credible threat of additional tariffs. The White House will therefore not offer a clear path to tariff negotiations. Rather, uncertainty is seen as providing leverage in the upcoming tariff negotiation.
Third, the Trump administration apparently seeks to frontload the disruptive part of its policy agenda, namely public sector job cuts and tariffs, in order to avoid too much of an overlap with the mid-term elections in 2026. At the end of the day, tariffs remain at odds with Trump’s primary mandate from voters, which is to bring down inflation, and therefore poses a risk to Republicans performance in the mid-term election. Consequently, the trade rhetoric from the White House is expected to soften as the year progresses. The less disruptive part – deregulation and tax cuts – is subject to lengthy negotiations in congress and at best themes for the second half of 2025 or even beyond.
EMD in times of geopolitical turbulence
Current trade tensions are cementing a regime shift towards permanently higher geopolitical uncertainty. But as highlighted above, there are good reasons to believe that geopolitical uncertainty is close to a peak. Ultimately, we expect geopolitical risks to mean-revert to a range above its historical average, but below the current levels, those spikes seen during the first Trump term, the pandemic or Russia’s invasion of Ukraine. This amounts to the blue area in Chart 2.
In such a regime, most EMD segments have shown robust returns (see light-blue bars in diagram 1). What’s more, segments often perceived as most risky within the EMD universe, i.e. Frontier Markets and local currency sovereign debt, tend to outperform. Current year-to-date performance confirms this picture, see chart 1.
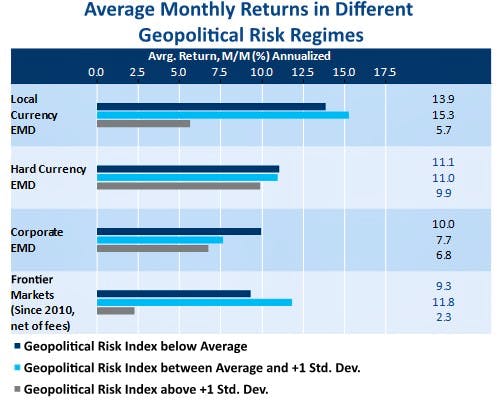
Please note: As a proxy for EM HC, LC and HC Corp debt performance above, the three major EMD indices JPM EMBIGD, JPM GBIEMGD and JPM CEMBIBD is used. Global Evolutions Frontier blended currency debt composite is used as a proxy for the above frontier markets performance. All performance shown above is net of fees. For definition and historic returns of the above referenced indices and composite please refer to table 1 in the back of this document. Past performance is not indicative of future results which may differ materially from past performance.
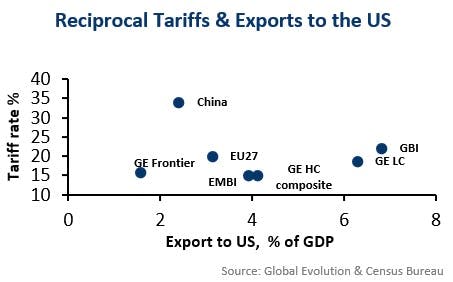
The outperformance of Frontier Market debt follows intuitively from the fact that these countries tend to be less correlated with global risk factors. As compared to other EMD segments, they are predominantly driven by idiosyncratic factors. Due to Frontier market’s limited penetration of foreign bond holders, particularly the local currency share exhibits lower drawdown risks during times of market stress. In the context of trade uncertainty and tariff risks, it is also worth highlighting that Frontier Markets in aggregate are confronted with a similar US tariff rate as their EMD hard currency peers and a lower tariff rate than local currency EMD countries (see chart 5 below). In addition, Frontier countries have a relatively lower export exposure to the US economy when measured as a % of their GDP. All these factors help to explain the outperformance of EM Frontier Debt in times of high, but not too high geopolitical risks.
EM FX: Unprecedented de-correlation
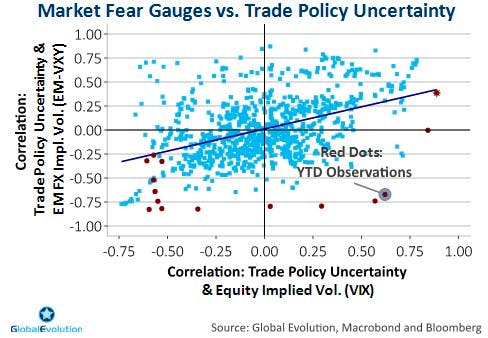
Maybe more surprising is the outperformance of local currency EMD during times of elevated geopolitical risks. A highly unusual correlation pattern between market risk aversion and EM FX goes a long way in explaining the year-to-date outperformance of local currency EM debt. As chart 6 highlights, the usual pattern is that EM FX implied volatility (a fear gauge for FX markets) is positively correlated with trade policy uncertainty. The same goes for equity market implied volatility (VIX). In 2025, however, correlation patterns changed. This year, EM FX has largely shrugged off rising trade policy uncertainty (negative correlation), while equity market risk aversion has risen in tandem with stiffening tariff headwinds (positive correlation). We believe there are cyclical and structural drivers behind such de-correlation. On the cyclical side, fading US exceptionalism has prevented the US Dollar from appreciating despite the latest risk-off mood. This has helped EM FX risk aversion to decouple from geopolitical risks. Structurally, policy uncertainty emanating from the White House might have undermined the “exorbitant privilege” of the US Dollar being the global reserve currency – at least at the margin.
The allure of Frontier and local currency debt
In sum, the surprising resilience of EM debt is not a fluke but can be explained by structural as well as cyclical factors. Provided geopolitical uncertainty and trade policy uncertainty, in particular, are in the process of peaking, we believe this robust performance pattern will continue – despite lingering geopolitical uncertainty. As the above analysis shows, Frontier Market debt and local currency sovereign debt look particularly well positioned for such an environment. Clearly, peak geopolitical uncertainty does not mean EM debt is immune to headwinds from tariffs - even if these are being lowered over the coming months, as we currently expect. In order to mitigate tariff risks, we are underweight Asian EM countries, as the region screens most vulnerable to higher US tariffs on various measures.
Policy, not data will guide markets
A final word on risk and reward in the wake of our main scenario of peaking geopolitical uncertainty, paving the way for robust EMD returns over the coming months. The April 2 tariffs announcements are still being digested and the situation remains fluid. Additional near-term setbacks are far from ruled out as headline risk is high and the range of outcomes wide. Over the summer, hard data is very likely to weaken as the tariff-induced confidence shock takes its toll. But in a policy-driven growth slowdown or - worst case - recession, markets will take guidance from policy (leading), not data (lagging). This makes the “peak uncertainty” thesis even more decisive.
On the policy front, investors are currently witnessing a game of chicken between the White House, its trading partners and the Fed. Ultimately, one or more players will blink, delivering some kind of policy put. The 90-day break from reciprocal tariffs indicates that we might not be that far from a strike level for such a put, effectively limiting the downside potential in the months to come. At the same time, the set-back following the reciprocal tariff announcements on April 2 have created better entry points from a valuation perspective, particularly in lower- rated segments. EMD investors should therefore not lose sight of the opportunities and return potential, despite of the regime shift towards permanently higher geopolitical uncertainty.
[1] For overview of indices and composite performance please refer to table 1 in the back of this document.
[2] For the sake of simplicity, transparency and consistency, we rely on the type of news-based policy uncertainty indices developed by Baker, Bloom and Davis, see here for more details.
[3] Based on a range of model estimates of the impact of tariffs on GDP, we assume a hit to annual US GDP growth ranging between 0.1-0.14 %-pt. per 1 %-pt. increase in the US effective tariff rate.
Disclaimer & Important Disclosures
Global Evolution Asset Management A/S (“GEAM”) is incorporated in Denmark and authorized and regulated by the Danish FSA (Finanstilsynet). GEAM DK is located at Buen 11, 2nd Floor, Kolding 6000, Denmark.
GEAM has a United Kingdom branch (“Global Evolution Asset Management A/S (London Branch)”) located at Level 8, 24 Monument Street, London, EC3R 8AJ, United Kingdom. This branch is authorized and regulated by the Financial Conduct Authority under FCA # 954331. In Canada, while GEAM has no physical place of business, it has filed to claim the international dealer exemption and international adviser exemption in Alberta, British Columbia, Ontario, Quebec and Saskatchewan.
In the United States, investment advisory services are offered through Global Evolution USA, LLC (‘Global Evolution USA”), a Securities and Exchange Commission (“SEC”) registered investment advisor. Global Evolution USA is located at: 250 Park Avenue, 15th floor, New York, NY. Global Evolution USA is a wholly owned subsidiary of Global Evolution Financial ApS, the holding company of GEAM. Portfolio management and investment advisory services are provided to GE USA clients by GEAM. GEAM is exempt from SEC registration as a “participating affiliate” of Global Evolution USA as that term is used in relief granted by the staff of the SEC allowing U.S. registered investment advisers to use investment advisory resources of non-U.S. investment adviser affiliates subject to the regulatory supervision of the U.S. registered investment adviser. Registration with the SEC does not imply any level of skill or expertise. Prior to making any investment, an investor should read all disclosure and other documents associated with such investment including Global Evolution’s Form ADV which can be found at https://adviserinfo.sec.gov.
In Singapore, Global Evolution Fund Management Singapore Pte. Ltd (“Global Evolution Singapore”) has a Capital Markets Services license issued by the Monetary Authority of Singapore for fund management activities. It is located at Level 39, Marina Bay Financial Centre Tower 2, 10 Marina Boulevard, Singapore 018983.
GEAM, Global Evolution USA, and Global Evolution Singapore, together with their holding companies, Global Evolution Financial Aps and Global Evolution Holding Aps, make up the Global Evolution group affiliates (“Global Evolution”).
Global Evolution, Conning, Inc., Goodwin Capital Advisers, Inc., Conning Investment Products, Inc., a FINRA-registered broker-dealer, Conning Asset Management Limited, Conning Asia Pacific Limited, Octagon Credit Investors, LLC, and Pearlmark Real Estate, L.L.C. and its subsidiaries are all direct or indirect subsidiaries of Conning Holdings Limited (collectively, “Conning”) which is one of the family of companies whose controlling shareholder is Generali Investments Holding S.p.A. (“GIH”) a company headquartered in Italy. Assicurazioni Generali S.p.A. is the ultimate controlling parent of all GIH subsidiaries. Conning has investment centers in Asia, Europe and North America.
Conning, Inc., Conning Investment Products, Inc., Goodwin Capital Advisers, Inc., Octagon Credit Investors, LLC, PREP Investment Advisers, L.L.C. and Global Evolution USA, LLC are registered with the SEC under the Investment Advisers Act of 1940 and have noticed other jurisdictions they are conducting securities advisory business when required by law. In any other jurisdictions where they have not provided notice and are not exempt or excluded from those laws, they cannot transact business as an investment adviser and may not be able to respond to individual inquiries if the response could potentially lead to a transaction in securities.
Conning, Inc. is also registered with the National Futures Association. Conning Investment Products, Inc. is also registered with the Ontario Securities Commission. Conning Asset Management Limited is Authorised and regulated by the United Kingdom's Financial Conduct Authority (FCA#189316); Conning Asia Pacific Limited is regulated by Hong Kong’s Securities and Futures Commission for Types 1, 4 and 9 regulated activities; Global Evolution Asset Management A/S is regulated by Finanstilsynet (the Danish FSA) (FSA #8193); Global Evolution Asset Management A/S (London Branch) is regulated by the United Kingdom's Financial Conduct Authority (FCA# 954331); Global Evolution Asset Management A/S, Luxembourg branch, registered with the Luxembourg Company Register as the Luxembourg branch(es) of Global Evolution Asset Management A/S under the reference B287058. It is also registered with the CSSF under the license number S00009438. Conning primarily provides asset management services for third-party assets.
This publication is for informational purposes and is not intended as an offer to purchase any security. Nothing contained in this communication constitutes or forms part of any offer to sell or buy an investment, or any solicitation of such an offer in any jurisdiction in which such offer or solicitation would be unlawful.
All investments entail risk, and you could lose all or a substantial amount of your investment. Past performance is not indicative of future results which may differ materially from past performance. The strategies presented herein invest in foreign securities which involve volatility and political, economic and currency risks and differences in accounting methods. These risks are greater for investments in emerging and frontier markets. Derivatives may involve certain costs and risks such as liquidity, interest rate, market, and credit.
While reasonable care has been taken to ensure that the information herein is factually correct, Global Evolution makes no representation or guarantee as to its accuracy or completeness. The information herein is subject to change without notice. Certain information contained herein has been provided by third party sources which are believed to be reliable, but accuracy and completeness cannot be guaranteed. Global Evolution does not guarantee the accuracy of information obtained from third party/other sources.
The information herein is not intended to provide, and should not be relied upon for, accounting, legal or tax advice or investment recommendations.
Legal Disclaimer ©2025 Global Evolution.
This document is copyrighted with all rights reserved. No part of this document may be distributed, reproduced, transcribed, transmitted, stored in an electronic retrieval system, or translated into any language in any form by any means without the prior written permission of Global Evolution, as applicable.
Copyright © 2026 Global Evolution - All rights reserved