Dear visitor
You tried to access but this page is only available for
You tried to access but this page is only available for

Witold Bahrke
Senior Macro and Allocation Strategist
When the only constant is change
The macro landscape is changing rapidly and with it the investment environment. Rarely have investors witnessed such a density of structural shift within a relatively short time frame. Yesterday’s environment of low interest rates, low fiscal deficits, low inflation and low geopolitical risks seem long gone. In previous publications, we zoomed in on the consequences for EMD investors from some of the most prominent structural shifts we have in mind, e.g. inflation and geopolitics. A key consequence of the sum of these regime shifts has been shorter market cycles and a more uncertain investment environment as witnessed over recent years, in our view.
Looking ahead, the question to ask is whether we should extrapolate development or merely see it as a (albeit prolonged) intermezzo, resulting from the transition from one macro regime to another? If the answer is tilted towards the former, then how does such an investment environment impact the role of EMD in the context of broad asset allocation as well as the role of asset allocation within EMD? This piece tries to give some answers.
There is no common standard definition of a market cycle. The approach here is to map market cycles through the lense of risk-on, risk-off waves in financial markets. Here, a market cycle therefore is simply defined as the move from a risk-off regime to risk-on and back to risk-off. With global equities as a crude proxy for risk appetite, the threshold for entering a risk-off phase is when equities enter correction territory. This implies that the market cycle sequence starts with global equities recovering from a decline of min. 10% from their most recent peak (red parts of the drawdown line in Chart 1), then recovering to a new high (marked with green dots) and ends when global equities enter correction anew.
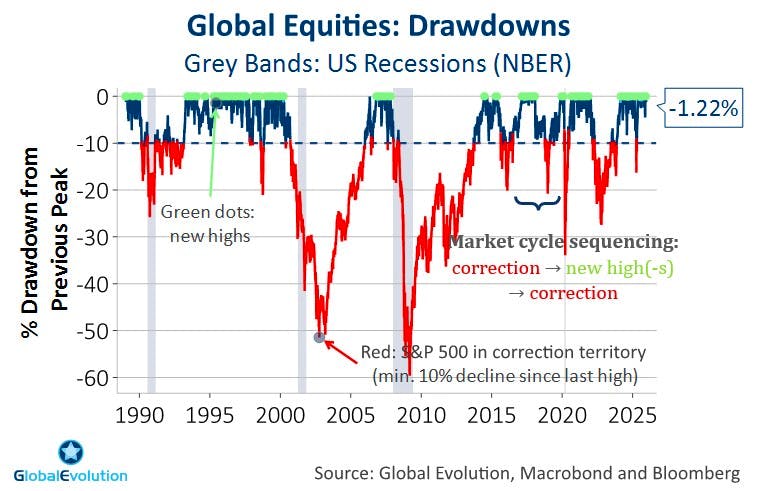
A market cycle defined in such way differs from a business cycle, running from recession to recession. Why not choose a higher hurdle for cyclical turning points, e.g. a bear market rather than a correction or a recession? We believe it does not require a bear market (min. 20% drawdown) and/or an outright recession to create fluctuations in markets and risk appetite that are relevant from an asset allocation perspective. In other words, for most investors, expecting a 10% drawdown in risk assets suffices to make them reconsider their tactical asset allocation. Setting the bar around a 20% drawdown looks too restrictive.
Defined in such way, market cycles have roughly halved over the past years. More concretely, the average length of a market cycle since 2015 stood at just over 2 years (26 months to be precise). Since the onset of the great moderation and until 2015, the average length of a market cycle was roughly twice as long (49 months on average). With the average wavelength of recent market cycles halving, this begs the question whether such pattern is a presage of what lies ahead or rather should be seen as a one-off. The answer naturally depends on what has driven more frequent shifts between risk-on and risk-off periods over the last decade.
Fast & furious: What’s driving shorter cycles?
Firstly, the geopolitical and policy regime shift we have debated in previous reports (see here and here) springs into mind. There’s strong evidence that these factors directly and indirectly contributed to market volatility and shorter market cycles, either changing the direction or amplifying existing moves. In fact, the last two market cycle turning points have been triggered by spiraling geopolitical risks (see Chart 1).
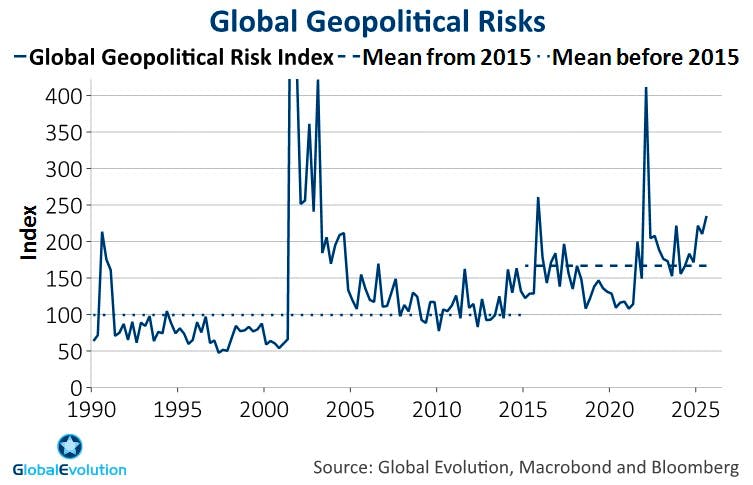
The Ukraine war in 2022 triggered a jump in geopolitical risks indices and a bear market in equities. The latest example is a quantum leap higher in trade policy uncertainty in 2025, causing a correction in equity markets and a significant widening in EM credit spreads. Chart 2 illustrates the regime shift from low to high geopolitical risk on the back of a more fragmented, multipolar world.
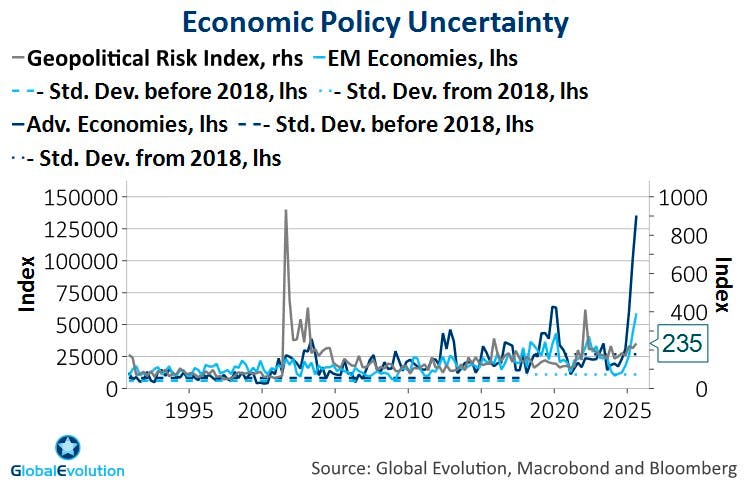
In the same vein, measures of economic policy uncertainty as such has trended higher and exhibited increased volatility (Chart 3). Moreover, as far as it is possible to split these types of indices into EM and DM components, it becomes clear that the level shift higher has been more pronounced in DM and EM. This hints at different implications for EM and DM from the geopolitical and policy regime shift described here - more about this aspect later.
Although spikes in policy uncertainty as seen in spring 2025 should remain highly exceptional in magnitude, a return to the pre-Trump era of relatively limited (trade) policy uncertainty looks unlikely, as well. Whether it is about the strategic rivalry between the US and China, the conflict between Ukraine and Russia or - more generally - the revival of populist political agendas, exemplified by the Trump administrations often-used “escalate-to-deescalate” strategy – none of these factors are likely to fade or reverse anytime soon.
Higher geopolitical uncertainty has directly and indirectly contributed to market volatility and shorter market cycles, either changing the direction or amplifying existing moves. In fact, the last two market cycle turning points have been triggered by spiraling geopolitical risks (see Chart 1).
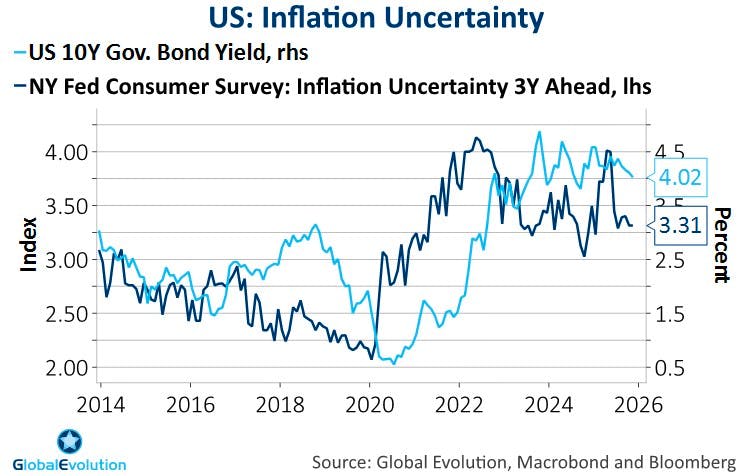
Secondly, the transition to shorter market cycles is closely linked to higher inflation. The Pandemic cemented the end of the “lowflation” environment many investors became accustomed to during the years between the Great Financial Crisis (GFC) and the pandemic. But it’s not only about higher inflation per se. Inflation uncertainty experienced a level-shift higher, as well. And despite inflation itself coming down somewhat after a post-pandemic spike, inflation uncertainty seems to have stayed elevated (see Chart 4). From a macro stability perspective, higher inflation uncertainty is arguably at least as challenging as high inflation itself. It creates planning problems in the wider economy and undermines central bank’s ability to use forward guidance, ultimately threatening hard-won central bank credibility.
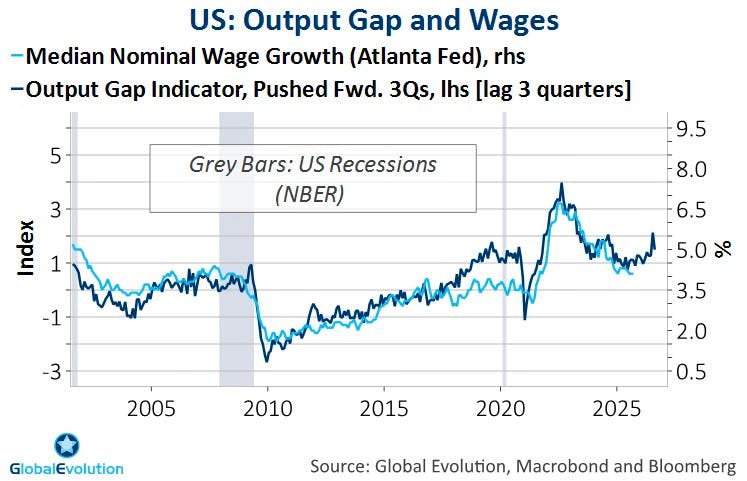
Notwithstanding the recent moderation in global inflation and a so far limited pass-through from tariffs to headline inflation, there’s no reason for inflation complacency at the current juncture. With US unemployment still sitting at relatively low levels, stalling labour supply and no appetite to reign in fiscal spending in industrialized countries, the underlying drivers behind higher inflation remain very much in place, particularly in the DM space. More concretely, the combination of supply side constraints (e.g. limited labour supply in the US and strained global supply chains) combined with positive demand shocks stemming from fiscal stimulus and lagged effects of monetary easing could re-widen the output gap as we head into 2026 (see here). This could quickly cause underlying inflation to reaccelerate, see Chart 5. According to the Dallas Fed, the monthly growth rate in employment needed to keep unemployment steady stands at a meager 30.000, so once the US government shutdown has been digested, even modest job growth could cause unemployment to decline from already low levels. In addition, while the US effective tariff rates is set to rise further in the coming months. Hence, there is still upside risk to inflation from tariffs.
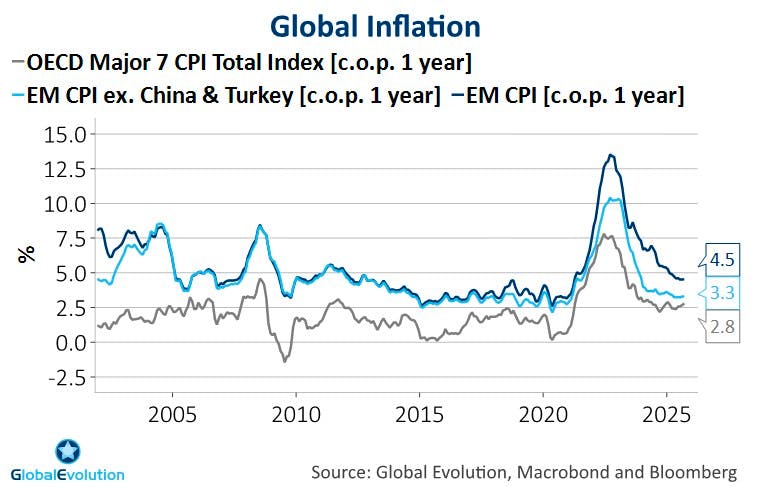
On the other hand, downside risks to the business cycle cannot be ignored, underlying that two-way risks to inflation persist. As with the geopolitical side of things, it is important to highlight the unbalanced nature of higher inflation in the post-Pandemic era. Without going into detail, as we covered this topic in a previous publication, the chart serves a as a reminder that EM inflation outperformed DM inflation over the past few years. EM countries’ inflation has returned to the pre-Pandemic trend. The same cannot be said about DM inflation. As with the geopolitical factors described above, we need to keep this divergence in mind when assessing the impact on EMD.
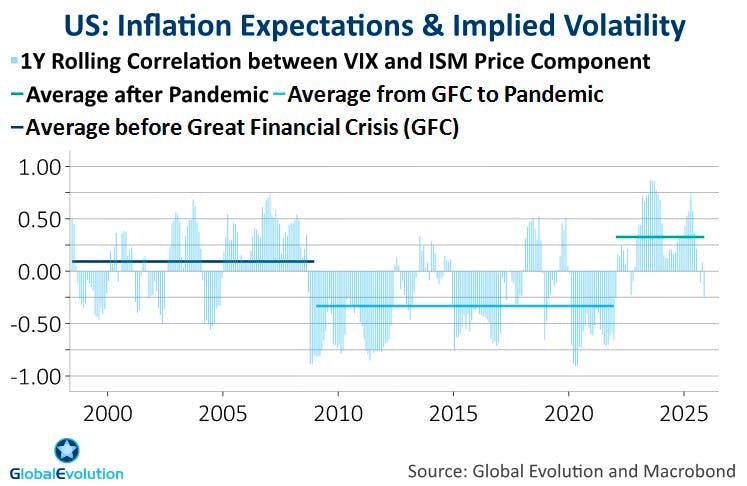
In an environment of persistent inflation uncertainty, DM central banks easing bias has largely vanished. Markets have reacted accordingly. Whereas the correlation between gauges of risk appetite such as the Vix index and forward-looking measures of price pressure has been negative in the low-flation era between the GFC and the Pandemic, it flipped back into positive territory in the aftermath of the Pandemic (Chart 7). Put differently, markets have transitioned from welcoming a bit more inflation to becoming scared whenever inflation risks run hot – because central banks are forced to react in a decisively hawkish way, now more so than in the past. Technically speaking, the beta of policy rates to measures of inflation is positively correlated with inflation itself.
The bottom-line is that it has become much harder for central banks to smooth both business and market cycles. Both the shift higher in DM trend-inflation away from central banks targets as well as a more uncertain inflation trajectory is threatening central bank credibility. This has forced DM central banks and particularly the Fed to remove its easing bias.
In addition, through the re-emergence of supply-side uncertainties, central banks find it much harder to take a firm view of where we are in the business cycle, which makes conducting monetary policy even more challenging. The response from DM central banks has been to navigate in a “data-dependent” way. However, that means monetary policy is becoming more reactive and backward-looking, altogether pointing to a more volatile macro environment and shorter market cycles. As the underlying drivers behind higher inflation and inflation uncertainty are unlikely to reverse anytime soon, the resulting shortening of market cycles is here to stay, as well.
EMD beyond carry: Diversification appeal…
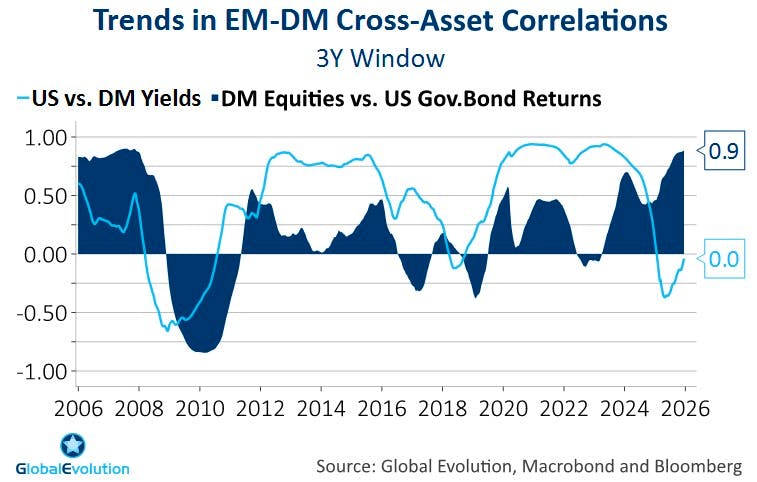
A changing investment environment characterized by shorter market cycles has wide-ranging consequences for asset allocation between DM bonds and EM Debt as well as within EMD. It’s hardly a coincidence that cross-asset correlations have changed markedly over the recent years. The starkest example is presumably a sharply rising correlation between equities and core bonds, the main building blocks of the classic 60/40 portfolio. Intuitively, the shift higher makes sense, particularly considering the message from Chart 7. Both core bonds and equities suffer when inflation picks up. This means Treasuries, Bunds & co. do not shield balanced portfolios the way they have done as markets have become jittery about inflation.
Investor’s ability to diversify within the DM universe has deteriorated as the correlation between risk assets and DM core bonds has risen. If our thesis of shorter cycles driven by higher inflation and geopolitical risks proves correct, centering a well-diversified portfolio around the classic 60/40 bonds-equity allocation might not do the trick anymore. At the same time, more frequent turns in risk appetite makes diversification ever more relevant. How to square the circle? Broadening the diversification opportunity set becomes an investment imperative.
Rethinking the role of EM debt as an additional source of diversification can help alleviate such diversification headaches. On the back of relative policy discipline and EM inflation outperformance relative to DM inflation, the correlation between EM yields and core yields has plummeted (Chart 8). When it comes to the need for diversification, EMD’s attractiveness relative to core fixed income seems to improve, despite shorter market cycles and a more uncertain investment environment.
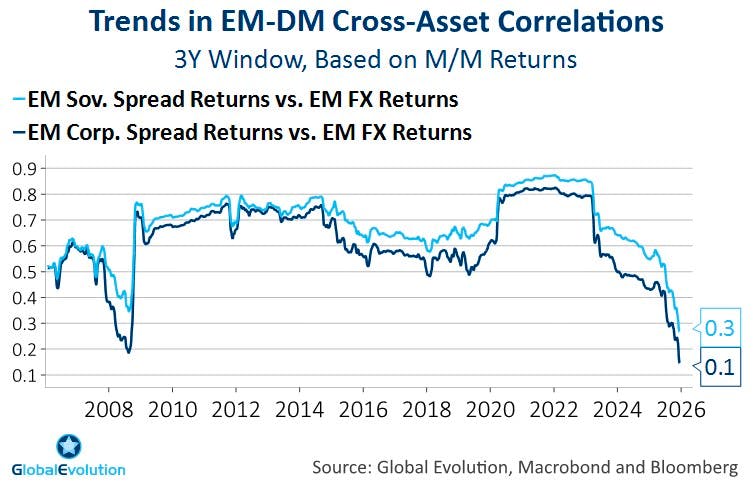
The same tendency of declining correlations becomes evident when diving deeper into the main segments and key returns drivers within EMD. The correlation between credit risk on the hard currency side and EM FX risk on the local currency side has dropped to the to the lowest levels since the GFC (Chart 9). As such, there is strong evidence for improving diversification opportunities when deploying an active asset allocation approach between DM and EMD well as within EMD. A natural pushback to our arguments is that the rapid decorrelation between EMD risk premiums simply reflects the recent US Dollar weakness, end of story. It is hard to argue against Dollar weakness impacting correlations. However, rather than undermining our rationale, it is very much in line with our overall take presented here. The key question is why the US Dollar has faced stiff headwinds as of late. Namely, the US Dollar’s decline is very much happening because the drivers behind a more uncertain and volatile investment environment are not only skewed towards DM, but often towards the US itself. Hence, the weak USD is a very prominent symptom of the regime shifts described in this piece (for more details, see here).
…and improving risk/reward relative to DM bonds
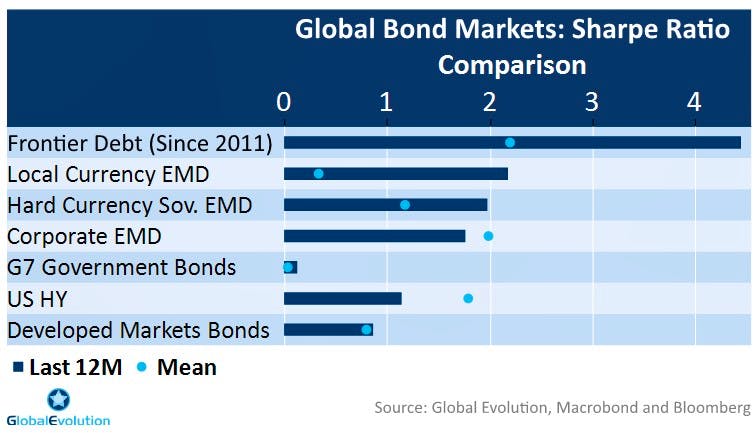
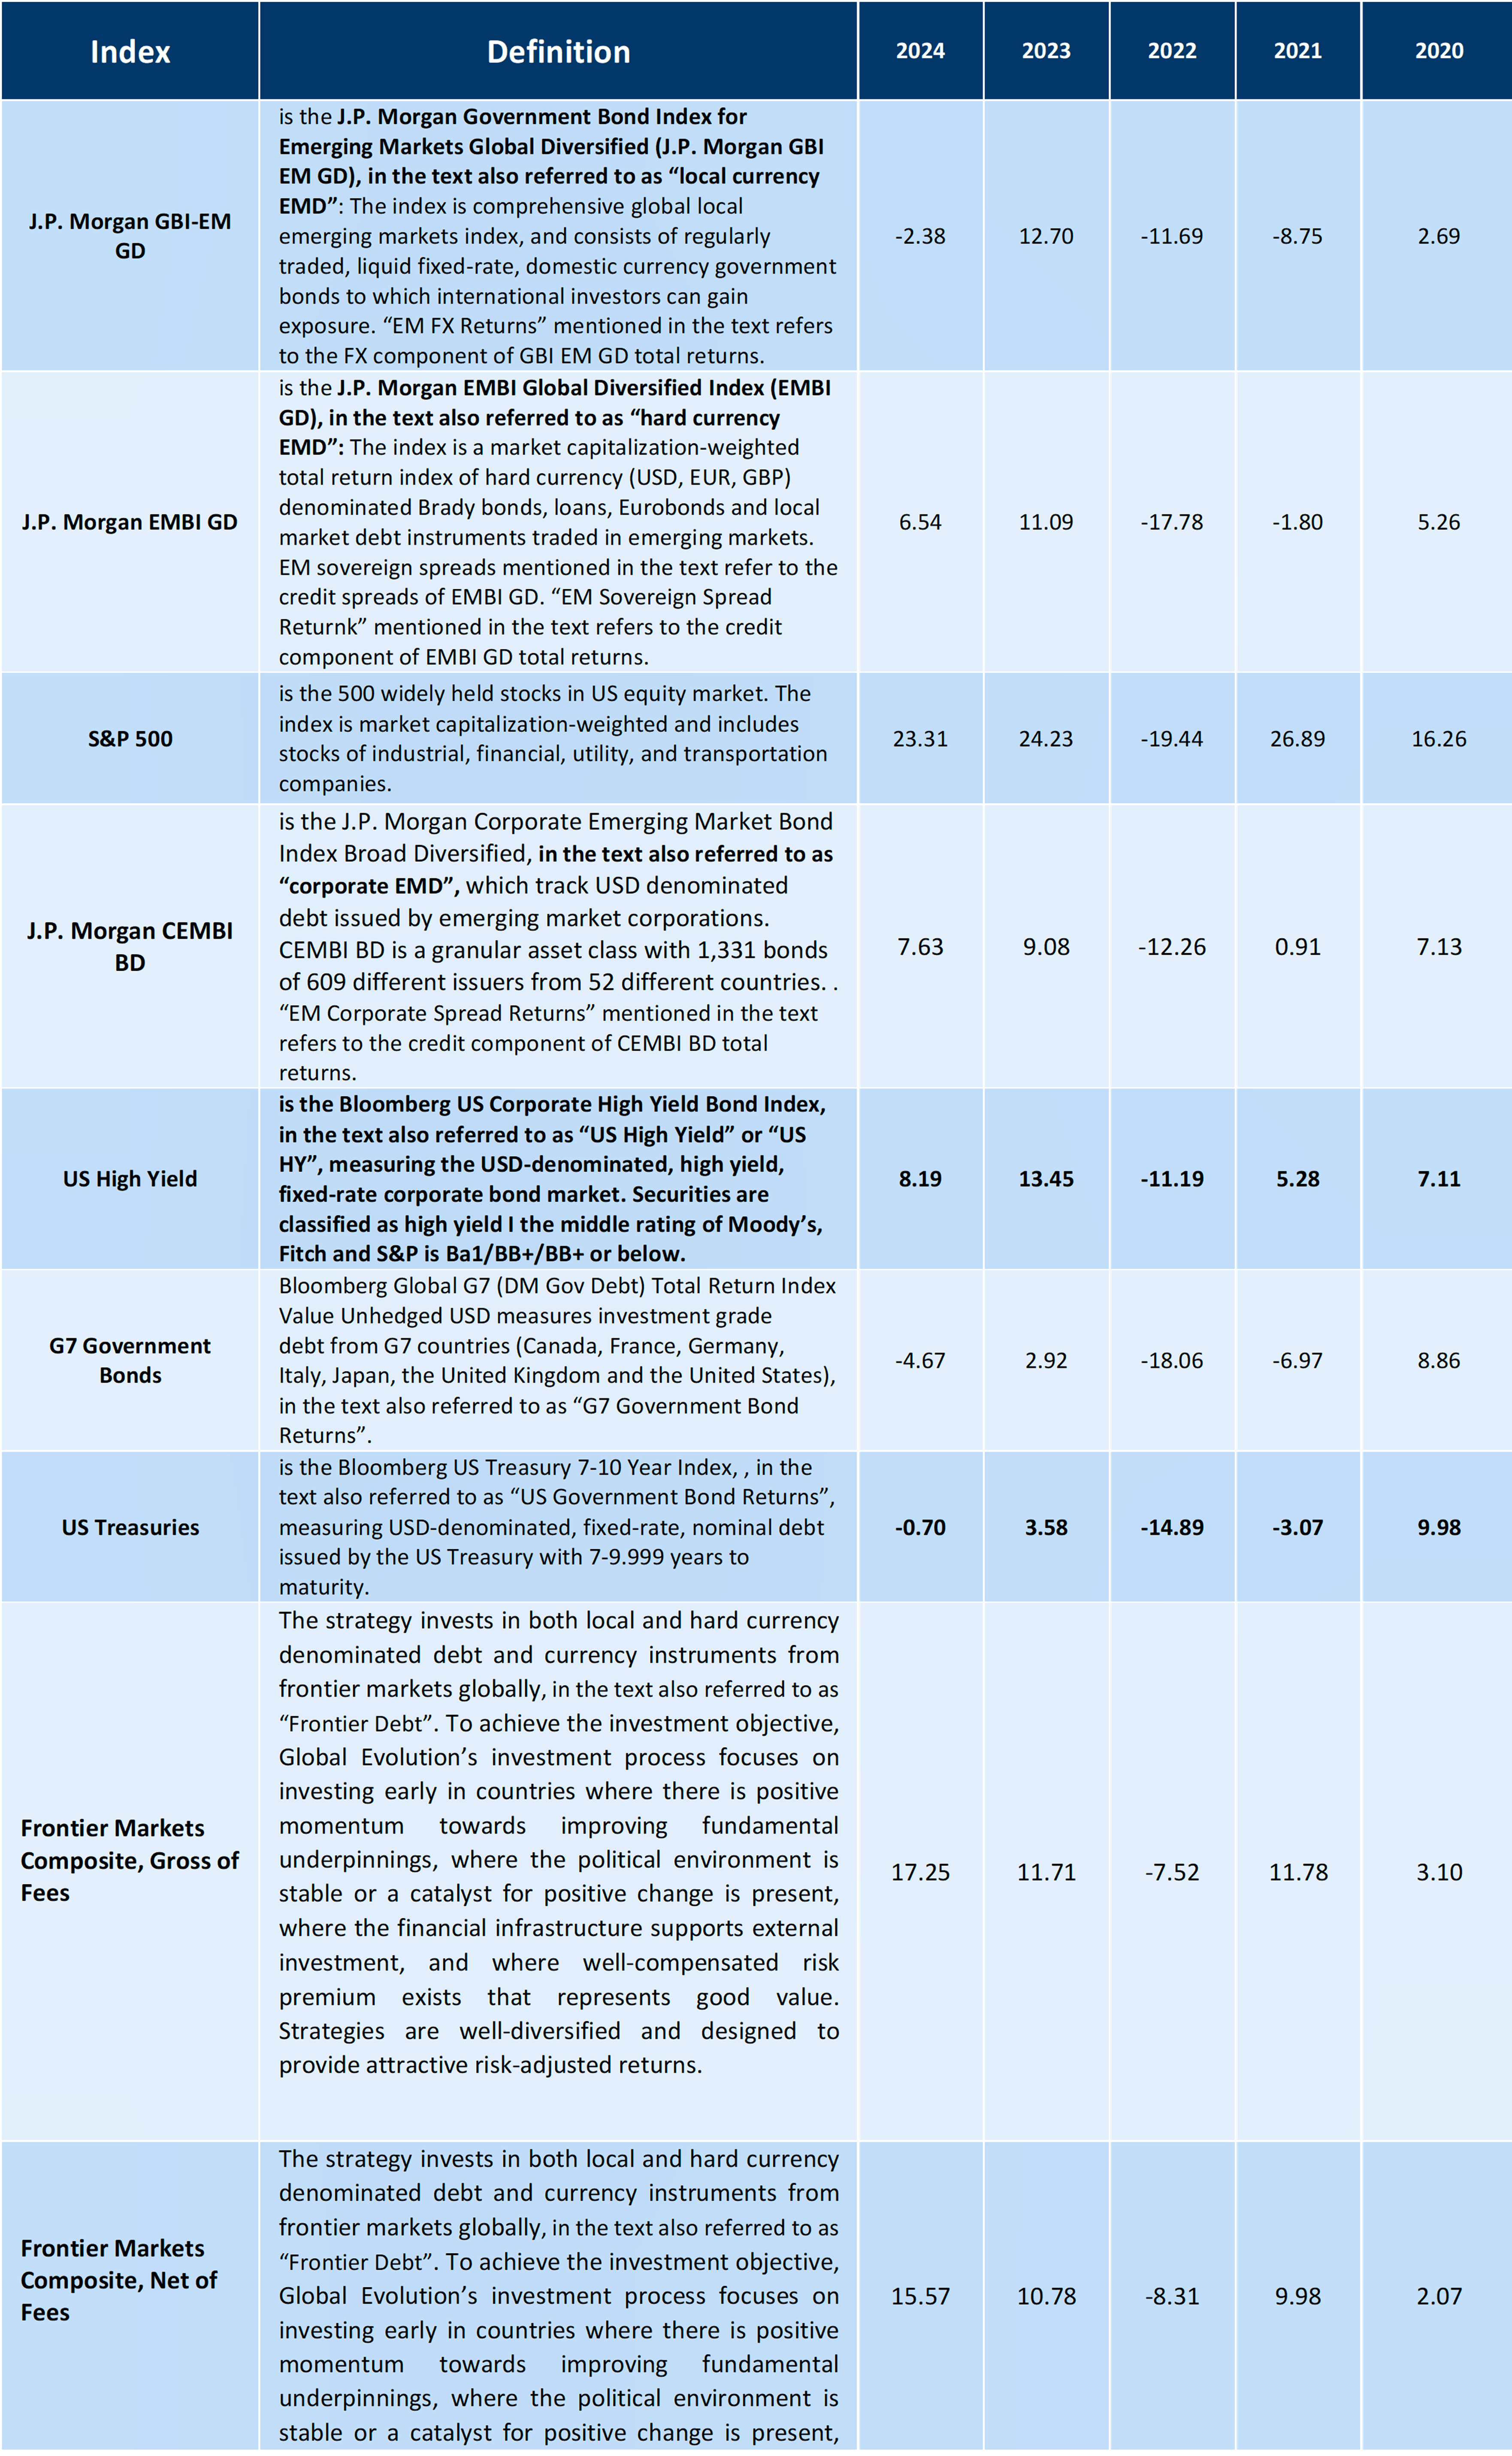
The potential merits of EMD in an asset allocation is not only about diversification per se. How has the risk-reward profile of EMD evolved in times of shorter market cycles? The short answer is surprisingly well. Sharpe ratios – serving as a crude proxy for risk/reward in the asset class – have outperformed their historical averages as of late, with the exception of EM corporate bonds (see Chart 10). This is particularly noteworthy as key DM peers such as US High Yield bonds haven’t seen the same strength in their risk-adjusted return profile relative to their own history.
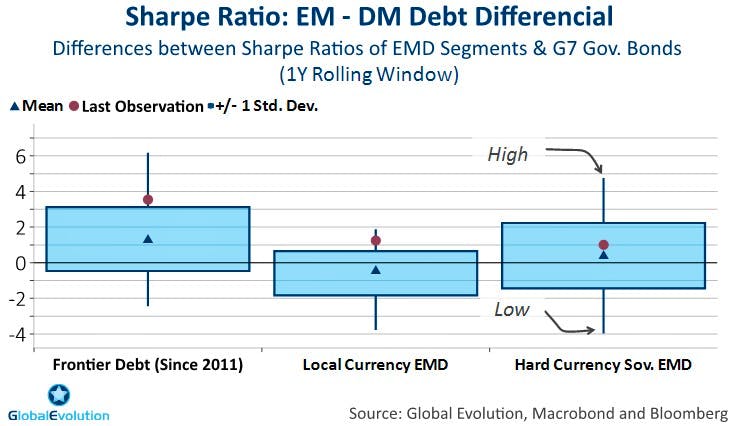
Comparing EMD risk-return profiles with those of core government bonds, they are in the grand scheme of things outperforming their DM bond peers. More concretely, the difference between EMD and DM bond Sharpe ratios are generally positive and in the high end of their historical range (Chart 11). EM hard currency sovereign debt is lagging a bit given that its returns are partly driven by core duration, not benefitting from EM’s relative outperformance in macro terms.
Perception is not reality: Asset allocation takeaways
The bottom-line is that investing in EMD has become less one-dimensional on the back of shorter market cycles experienced in recent years. Put simply, it’s not simply a question of optimizing carry anymore. Contrary to the common perception, EMD’s diversification appeal and risk/return profile is set to improved relative to DM debt on the back of a transition to an investment environment shaped by shorter market cycles. Thinking beyond carry, we see two overarching asset allocation take-aways for the years to come.
Firstly, searching for diversification alternatives to core bonds in balanced portfolios argues for a more prominent role for EMD in a cross-asset context. While DM fixed income’s diversification appeal has been watered down after the Pandemic, EMD has moved in the opposite direction. Particularly EM FX risk and EM duration risk haven’t suffered from the same rise in volatility and correlation with e.g. global equity risk as compared to core bonds in the post-Pandemic years. At the same time, risk-adjusted returns remained attractive both absolutely and relatively, largely shrugging off a more uncertain investment environment on the back of shorter market cycles. After all, the key factors causing the length of market waves to shorten are rooted in the DM sphere, not so much in EM, emphasizing the importance of EMD in balanced portfolios as the risk-adjusted returns of core bonds is deteriorating.
Secondly, an active tactical asset allocation approach within EMD - e.g. in blended EMD mandates - becomes ever more important as correlations between the main EMD returns drivers are declining. Meanwhile, the respective EMD risk premiums still exhibit systematic covariation with traditional macro factors such as growth and monetary conditions. How to best exploit this in order to optimize risk-adjusted returns in an asset allocation process is beyond the scope of this publication. But based on the analysis above, the key point here is that EMD investors could benefit from embracing the volatility stemming from shorter market cycles rather than hide in traditional diversifiers like core bonds. When combined with an active asset allocation approach, the new market order gives investors the opportunity to improve portfolio diversification as well as adding an additional source of returns to EMD portfolios.
Disclaimer & Important Disclosures
Global Evolution Asset Management A/S (“Global Evolution DK”) is incorporated in Denmark and authorized and regulated by the Finanstilsynets of Denmark (the “Danish FSA”). Global Evolution DK is located at Buen 11, 2nd Floor, Kolding 6000, Denmark.
Global Evolution DK has a United Kingdom branch (“Global Evolution Asset Management A/S (London Branch)”) located at Level 8, 24 Monument Street, London, EC3R 8AJ, United Kingdom. This branch is authorized and regulated by the Financial Conduct Authority under the Firm Reference Number 954331.
In the United States, investment advisory services are offered through Global Evolution USA, LLC (‘Global Evolution USA”), an SEC registered investment advisor. Registration with the SEC does not infer any specific qualifications Global Evolution USA is located at: 250 Park Avenue, 15th floor, New York, NY. Global Evolution USA is an wholly-owned subsidiary of Global Evolution Asset Management A/S (“Global Evolution DK”). Global Evolution DK is exempt from SEC registration as a “participating affiliate” of Global Evolution USA as that term is used in relief granted by the staff of the SEC allowing U.S. registered investment advisers to use investment advisory resources of non-U.S. investment adviser affiliates subject to the regulatory supervision of the U.S. registered investment adviser. Registration with the SEC does not imply any level of skill or expertise. Prior to making any investment, an investor should read all disclosure and other documents associated with such investment including Global Evolution’s Form ADV which can be found at https://adviserinfo.sec.gov.
In Singapore, Global Evolution Fund Management Singapore Pte. Ltd has a Capital Markets Services license issued by the Monetary Authority of Singapore for fund management activities. It is located at Level 39, Marina Bay Financial Centre Tower 2, 10 Marina Boulevard, Singapore 018983.
Global Evolution is affiliated with Conning, Inc., Goodwin Capital Advisers, Inc., Conning Investment Products, Inc., a FINRA-registered broker dealer, Conning Asset Management Limited, Conning Asia Pacific Limited and Octagon Credit Investors, LLC are all direct or indirect subsidiaries of Conning Holdings Limited (collectively, “Conning”) which is one of the family of companies owned by Cathay Financial Holding Co., Ltd., a Taiwan-based company. Conning has offices in Boston, Cologne, Hartford, Hong Kong, London, New York, and Tokyo.
Conning, Inc., Conning Investment Products, Inc., Goodwin Capital Advisers, Inc., Octagon Credit Investors, LLC, are registered with the Securities and Exchange Commission (“SEC”) under the Investment Advisers Act of 1940 and have noticed other jurisdictions they are conducting securities advisory business when required by law. In any other jurisdictions where they have not provided notice and are not exempt or excluded from those laws, they cannot transact business as an investment adviser and may not be able to respond to individual inquiries if the response could potentially lead to a transaction in securities. Conning, Inc. is also registered with the National Futures Association and Korea’s Financial Services Commission. Conning Investment Products, Inc. is also registered with the Ontario Securities Commission. Conning Asset Management Limited is authorised and regulated by the United Kingdom's Financial Conduct Authority (FCA#189316), Conning Asia Pacific Limited is regulated by Hong Kong’s Securities and Futures Commission for Types 1, 4 and 9 regulated activities
This publication is for informational purposes and is not intended as an offer to purchase any security. Nothing contained in this website constitutes or forms part of any offer to sell or buy an investment, or any solicitation of such an offer in any jurisdiction in which such offer or solicitation would be unlawful.
All investments entail risk and you could lose all or a substantial amount of your investment. Past performance is not indicative of future results which may differ materially from past performance. The strategies presented herein invest in foreign securities which involve volatility and political, economic and currency risks and differences in accounting methods. These risks are greater for investments in emerging and frontier markets. Derivatives may involve certain costs and risks such as liquidity, interest rate, market and credit.
This communication may contain Index data from J.P. Morgan or data derived from such Index data. Index data information has been obtained from sources believed to be reliable but J.P. Morgan does not warrant its completeness or accuracy. The Index is used with permission. The Index may not be copied, used, or distributed without J.P. Morgan's prior written approval. Copyright 2025, J.P. Morgan Chase & Co. All rights reserved.
While reasonable care has been taken to ensure that the information herein is factually correct, Global Evolution makes no representation or guarantee as to its accuracy or completeness. The information herein is subject to change without notice. Certain information contained herein has been provided by third party sources which are believed to be reliable, but accuracy and completeness cannot be guaranteed. Global Evolution does not guarantee the accuracy of information obtained from third party/other sources.
The information herein is not intended to provide, and should not be relied upon for, accounting, legal or tax advice or investment recommendations. This document does not constitute investment advice. The contents of this document represent Global Evolution's general views on certain matters, and is not based upon, and does not consider, the specific circumstance of any investor.
Legal Disclaimer ©2025 Global Evolution.
This document is copyrighted with all rights reserved. No part of this document may be distributed, reproduced, transcribed, transmitted, stored in an electronic retrieval system, or translated into any language in any form by any means without the prior written permission of Global Evolution, as applicable.
Copyright © 2026 Global Evolution - All rights reserved