Dear visitor
You tried to access but this page is only available for
You tried to access but this page is only available for


Michael Nguyen
Lead of Quantitative Research
An investment in Emerging Market Debt (EMD) presents an opportunity to diversify and enhance returns in a traditional 60% stocks and 40% bonds portfolio. EMD offers a unique risk profile compared to developed markets, and the asset class is diversified within itself. This analysis evaluates the historical performance of EMD compared to other asset classes and examines the benefits of allocating to EMD historically.
Beyond historical evidence, we also consider a forward-looking scenario shaped by a potential structural shift in the U.S. dollar (DXY). Cyclical drivers such as expected Federal Reserve rate cuts already point toward EURUSD appreciation, but deeper structural forces — including the weaponization of the dollar in geopolitics, its declining share of global reserves, and rising risks from U.S. tariff policies — suggest a longer-term weakening trend for the DXY. This has significant implications for portfolio construction, particularly for assets like local-currency EMD that directly benefit from dollar depreciation.
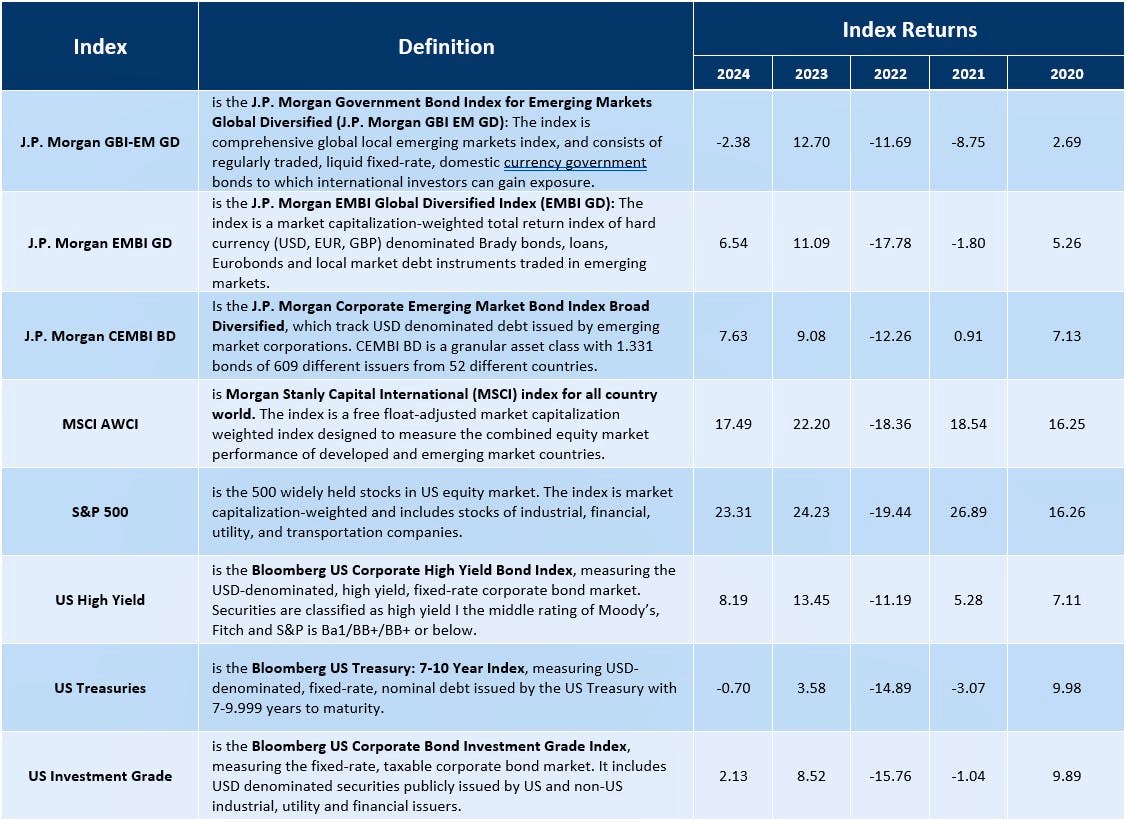
Accordingly, this study not only reviews EMD’s past role in enhancing risk-adjusted returns but also examines its strategic importance in a changing global financial paradigm where dollar dominance is gradually eroding. The analysis spans all major sub-asset classes within EMD, including both sovereign and corporate debt, alongside U.S. Treasuries, U.S. High Yield, U.S. Investment Grade Credit, U.S. Equities (S&P 500), and Global Equities (MSCI).
Historical Performance
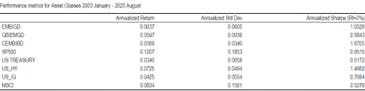
Our analysis of the historical returns, volatility, and correlation of these asset classes from January 2003 to August 2025 reveals that EMBIGD has historically outperformed US Treasury bonds by approximately 297 bps per annum, with EMBIGD achieving an annual return of 6.37% compared to 3.40% for US Treasury bonds. Furthermore, EMBIGD has a slightly lower annual volatility at 6.05% compared to 6.58% for US Treasury bonds, indicating a significantly higher Sharpe ratio for EMBIGD at 1.0526 compared to 0.5172 for US Treasury bonds.
When comparing DM corporates, specifically US HY and US IG, to EM corporates, namely CEMBIBD, we find that US HY and US IG have annual returns of 7.25% and 4.25%, respectively. In contrast, CEMBIBD has an annual return of 5.69%, lower than US HY but higher than US IG. However, US HY has a higher risk profile relative to CEMBIBD when considering volatility. Even US IG, which has a lower annual return than CEMBIBD, exhibits higher annual volatility. Therefore, from a risk-adjusted perspective, CEMBIBD is highly attractive compared to its DM counterparts, with a Sharpe ratio of 1.6705.
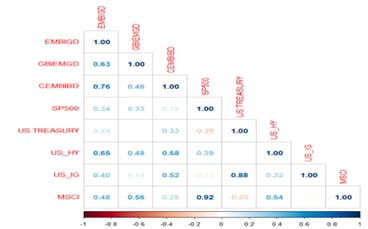
From a diversification perspective, we also examine the correlation between the assets which is shown in figure 1a. By comparing MSCI world with the 3 sub-asset classes within EMD, it is evident that GBIEMGD has the highest correlation at 0.56 and CEMBIBD the lowest correlation at 0.26 within these 3 asset classes. Interestingly, US HY has both a higher correlation relative to EMBIGD and CEMBI when measuring against MSCI.
Mean-Variance Optimization
Given the historical performance of the various asset classes, we now examine how an optimal portfolio would be if the historical performance would repeat itself again. We will use the mean-variance efficient frontier concept which was first introduced by Harry Markowitz in his seminal 1952 paper “Portfolio Selection”. The basic idea is to find the set of portfolios that offer the highest expected return for a given level of risk.
However, one of the main disadvantages of the traditional mean-variance optimization (MVO) which was proposed by Markowitz (1952) is that it is not very robust. This means that small changes in the input data such as expected returns or correlations can result in large changes in the optimized portfolio. This sensitivity in input data can lead to undiversified or unstable portfolios which can be problematic in practice. To address these issues, we will use a modified version of the traditional mean-variance optimization. We will use a resampling method proposed by Michaud (2007). This method uses simulation techniques called bootstrapping, to generate multiple sets of possible input data and then optimize portfolios based on the average characteristics of the simulated data. By doing so, we will get a more diversified and stable portfolio allocation that is less sensitive to small changes in input data and more realistic in the real world.
Optimization with Backward Looking Historical Data
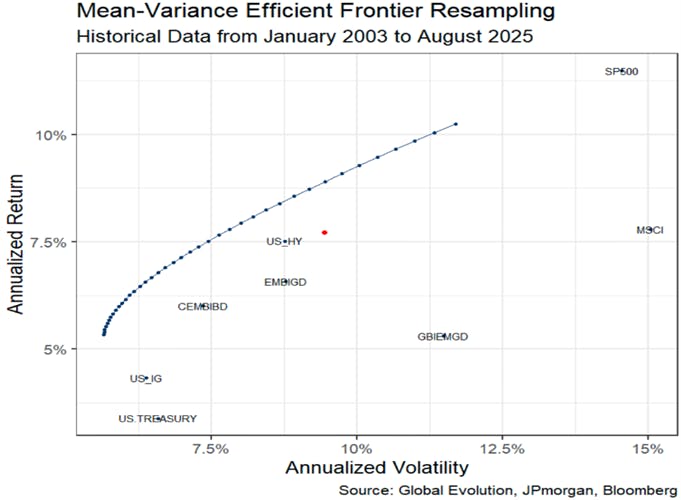
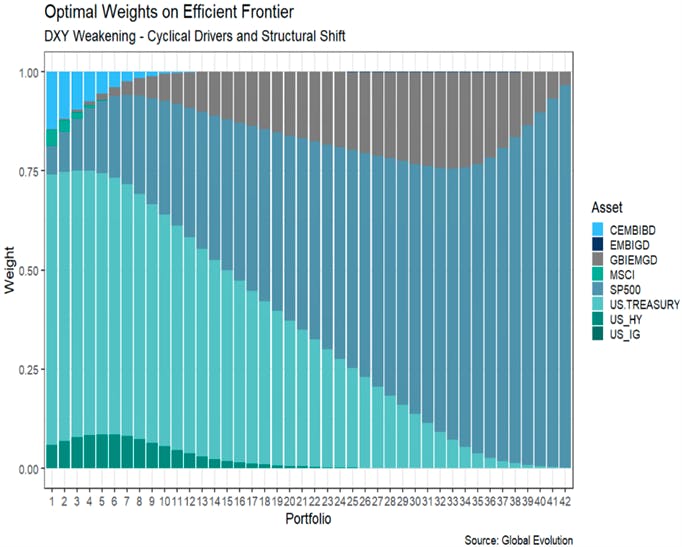
Figure 2a displays the efficient frontier produced by employing annual returns, volatilities, and correlations over the past two decades in our investable universe. Figure 2b illustrates the optimal weight allocations for each optimal portfolio (PF) that lies on the efficient frontier shown in figure 2a. For instance, PF number 1 corresponds to the minimum variance PF on the efficient frontier, located on the leftmost side. Similarly, PF number 40 corresponds to the maximum return PF on the efficient frontier, located on the rightmost side.
An examination of the minimum variance PF reveals that the highest weight is allocated to US treasuries, specifically 51.60%. This finding is unsurprising given that US treasuries have the lowest volatility and the most negative correlation with other asset classes. We also observe that riskier assets like S&P500 receive a relatively lower weight of 3.4% in this PF. Furthermore, the optimization model assigns 7.3%, 0.16%, and 6.38% to CEMBIBD, EMBIGD, and GBIEMGD, respectively, resulting in a total allocation of 13.84% to EMD in the minimum variance PF.
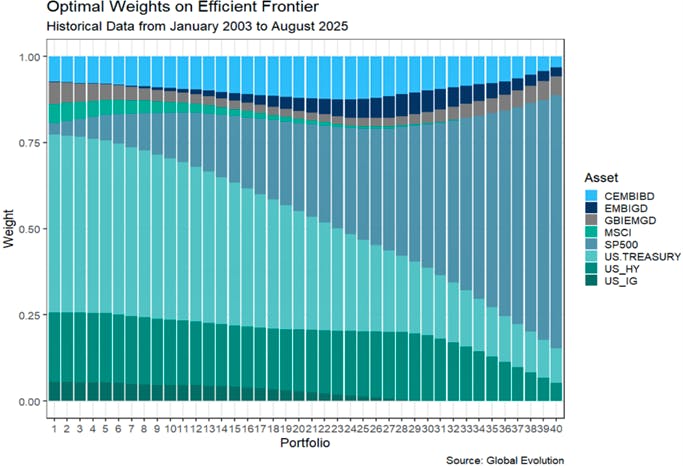
Conversely, the maximum return PF only assigns 10.09% to US treasuries, with the largest weight of 73.4% allocated to S&P500. In this PF, the model assigns 3.25%, 2.57%, and 5.47% to CEMBIBD, EMBIGD, and GBIEMGD, respectively, resulting in a total allocation of 11.29 % to EMD.
Notably, when we consider all the 40 portfolios listed on the efficient frontier, we observe that EMD consistently receives an allocation in the range of 11.29% to 20.34%.
Lastly, we have included a reference portfolio that does not have any EMD exposure to assess whether adding EMD would benefit a PF. This reference PF invests 30% in SP500, 30% in MSCI, 30% in US Treasuries, 5% in US HY, and 5% in US IG. It is represented by the red dot in figure 2a. This reference PF has an annual volatility of 9.45% and an annual return of 7.72%. If we compare this with PF number 33 on the efficient rand, which has the same risk profile as our reference PF, we see that PF number 33 has a volatility of 9.46% but a significantly higher return of 8.90%. We can infer from the weight allocation that PF number 33 allocates 8.51% to CEMBIBD, 5.26% to EMBIGD, and 4.03% to GBIEMGD.
Therefore, we can conclude that historical data suggests allocating to EMD exposure has been beneficial.
Optimization with Forward Looking Macro Views – A Structural Shift
In the previous section, we demonstrated that using historical returns would always allocate to EMD exposure in a MVO framework. However, relying solely on past data to predict future market conditions is not ideal, as historical data is inherently backward-looking. To incorporate forward-looking views into the optimization process, we construct a scenario that reflects the emerging structural regime of the U.S. dollar. One of the challenges in portfolio management is translating qualitative expectations into a systematic framework. To address this, we apply Entropy Pooling (EP) suggested by Meucci (2008), which allows portfolio managers’ forecasts or views to be expressed as probability distributions and incorporated directly into optimization. This approach yields a new efficient frontier that is consistent with the manager’s macro views.
Structural Shift – A Weaker DXY
In our forward-looking scenario, we consider both cyclical and structural drivers.
Cyclical driver: Markets are increasingly pricing in Fed rate cuts due to weaker macroeconomic data, such as disappointing non-farm payrolls. This erodes the interest rate differential between the U.S. and the euro area, supporting EURUSD appreciation.
Structural shift: Beyond cyclical forces, there are deeper shifts underway that point to a weaker dollar. The U.S. has increasingly weaponized the dollar in geopolitics, most visibly by freezing Russia’s reserves after the invasion of Ukraine. While effective as a sanctioning tool, this has raised concerns among other reserve-holding nations about the security of their U.S. assets. As a result, central banks particularly in emerging markets have accelerated diversification away from the dollar and into gold, the euro, and other alternatives. This trend is already evident in the steady decline of the dollar’s share of global FX reserves, which has fallen below 60% from over 70% two decades ago.
Trade policy risks: A more protectionist U.S. stance, including potential broad-based tariffs on imports, could also weigh on the dollar. Tariffs would likely add to domestic inflationary pressures, worsen the U.S. current account balance through retaliatory measures, and erode global confidence in U.S. policy credibility—all of which reduce demand for U.S. assets. The euro, by contrast, stands to benefit as a relatively neutral and stable alternative reserve currency.
Taken together, these cyclical drivers (Fed easing and narrowing interest rate differentials) and structural shifts (erosion of the dollar’s reserve dominance and trade policy risks) provide a compelling case for EURUSD to appreciate from 1.17 to 1.22 over the next year.
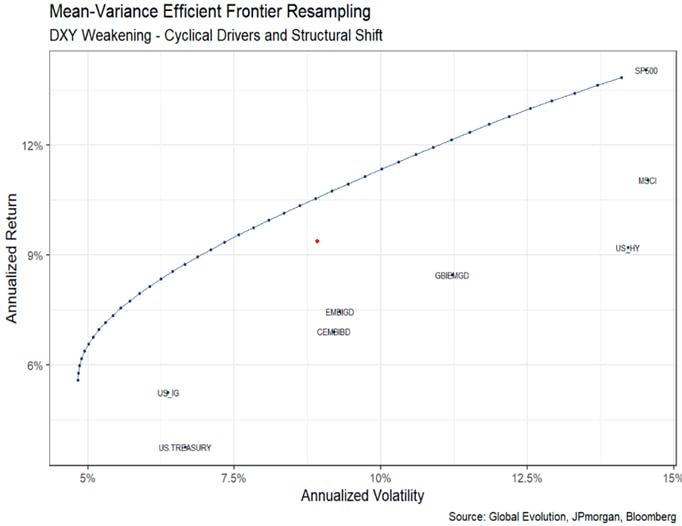
In this scenario, we observe that the higher risk asset classes will likely perform exceptionally well, as demonstrated by the new implied returns and volatilities shown in figure 3a. Specifically, the S&P500 and MSCI are expected to have returns of 14.05 % and 11.05%, respectively, which is higher than the historical distribution. Moreover, all EMD asset classes are expected to achieve significantly higher returns relative to the historical distribution, with GBIEMGD performing exceptionally well due to the positive view on EURUSD.
Upon analyzing the efficient frontier in our scenario, we find that the minimum variance portfolio allocates 14.50% to CEMBIBD due to its attractive volatility profile. However, as we move further out on the risk curve, we observe that the efficient frontier allocates increasingly more to GBIEMGD, as illustrated by the grey bars in figure 3b, as it now has the highest expected return within the EMD universe. When considering all 42 portfolios listed on the efficient frontier, we observe that EMD always receives an allocation ranging from 3.47% to 24.44%.
Finally, the reference portfolio in this scenario would yield an expected return of 9.38% with a volatility of 8.91%. Comparing this with Portfolio number 26, which has the same volatility profile, we find that the latter would yield an expected return of 10.55% with a volatility of 8.89%, while allocating 20.4% to GBIEMGD and 0% to both CEMBIBD and EMBIGD.
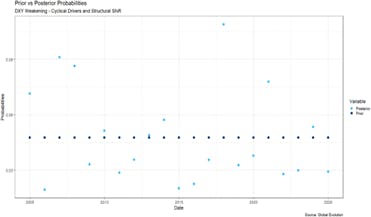
Figure 4a highlights the periods in which the Entropy Pooling framework assigns overweight allocations, such as 2006, 2007, 2017, and 2020. Notably, these episodes coincide with phases of EURUSD appreciation, consistent with the directional view established in our analysis.
Conclusion
This paper has examined the role of Emerging Market Debt (EMD) within a traditional 60/40 portfolio, drawing on both historical evidence and forward-looking scenarios. Historically, EMD has delivered favorable risk-adjusted returns compared to developed market counterparts, while also providing meaningful diversification benefits. Optimization exercises confirm that portfolios consistently allocate to EMD when constructed over more than two decades of data.
Looking ahead, the case for EMD strengthens further under a structural shift in the U.S. dollar regime. The increasing weaponization of the USD, its declining share in global reserves, and the risks associated with U.S. tariff policies all point toward a weaker DXY over time. In our forward-looking scenario analysis, such an environment enhances the performance of higher-risk assets, particularly local-currency EMD, which benefits directly from EURUSD appreciation. The optimization results demonstrate that in this structural regime, EMD allocations are not only sustained but expanded, producing superior portfolio outcomes relative to reference portfolios without EMD.
Therefore, EMD should be regarded not merely as a tactical diversifier, but as a strategic allocation in anticipation of a changing global financial paradigm.
References
Markowitz, Harry, Portfolio Selection (1952), The Journal of Finance, Vol. 7, No. 1 pp. 77-91
Michaud, Richard O. and Michaud, Robert, Estimation Error and Portfolio Optimization: A Resampling Solution (2007)
Meucci, Attilio, Fully Flexible Views: Theory and Practice (2008), Risk, Vol. 21, No. 10, pp. 97-102
Disclaimer & Important Disclosures
Global Evolution Asset Management A/S (“Global Evolution DK”) is incorporated in Denmark and authorized and regulated by the Danish FSA (Finanstilsynet). GEAM DK is located at Buen 11, 2nd Floor, Kolding 6000, Denmark.
Global Evolution DK has a United Kingdom branch (“Global Evolution Asset Management A/S (London Branch)”) located at Level 8, 24 Monument Street, London, EC3R 8AJ, United Kingdom. This branch is authorized and regulated by the Financial Conduct Authority under the Firm Reference Number 954331.
In the United States, investment advisory services are offered through Global Evolution USA, LLC (‘Global Evolution USA”), an SEC registered investment advisor. Registration with the SEC does not infer any specific qualifications Global Evolution USA is located at: 250 Park Avenue, 15th floor, New York, NY. Global Evolution USA is an wholly-owned subsidiary of Global Evolution Asset Management A/S (“Global Evolution DK”). Global Evolution DK is exempt from SEC registration as a “participating affiliate” of Global Evolution USA as that term is used in relief granted by the staff of the SEC allowing U.S. registered investment advisers to use investment advisory resources of non-U.S. investment adviser affiliates subject to the regulatory supervision of the U.S. registered investment adviser. Registration with the SEC does not imply any level of skill or expertise. Prior to making any investment, an investor should read all disclosure and other documents associated with such investment including Global Evolution’s Form ADV which can be found at https://adviserinfo.sec.gov.
In Singapore, Global Evolution Fund Management Singapore Pte. Ltd has a Capital Markets Services license issued by the Monetary Authority of Singapore for fund management activities. It is located at Level 39, Marina Bay Financial Centre Tower 2, 10 Marina Boulevard, Singapore 018983.
Global Evolution is affiliated with Conning, Inc., Goodwin Capital Advisers, Inc., Conning Investment Products, Inc., a FINRA-registered broker dealer, Conning Asset Management Limited, Conning Asia Pacific Limited and Octagon Credit Investors, LLC are all direct or indirect subsidiaries of Conning Holdings Limited (collectively, “Conning”) which is one of the family of companies owned by Cathay Financial Holding Co., Ltd., a Taiwan-based company. Conning has offices in Boston, Cologne, Hartford, Hong Kong, London, New York, and Tokyo.
Conning, Inc., Conning Investment Products, Inc., Goodwin Capital Advisers, Inc., Octagon Credit Investors, LLC, are registered with the Securities and Exchange Commission (“SEC”) under the Investment Advisers Act of 1940 and have noticed other jurisdictions they are conducting securities advisory business when required by law. In any other jurisdictions where they have not provided notice and are not exempt or excluded from those laws, they cannot transact business as an investment adviser and may not be able to respond to individual inquiries if the response could potentially lead to a transaction in securities. Conning, Inc. is also registered with the National Futures Association and Korea’s Financial Services Commission. Conning Investment Products, Inc. is also registered with the Ontario Securities Commission. Conning Asset Management Limited is authorised and regulated by the United Kingdom's Financial Conduct Authority (FCA#189316), Conning Asia Pacific Limited is regulated by Hong Kong’s Securities and Futures Commission for Types 1, 4 and 9 regulated activities.
This publication is for informational purposes and is not intended as an offer to purchase any security. Nothing contained in this website constitutes or forms part of any offer to sell or buy an investment, or any solicitation of such an offer in any jurisdiction in which such offer or solicitation would be unlawful.
All investments entail risk and you could lose all or a substantial amount of your investment. Past performance is not indicative of future results which may differ materially from past performance. The strategies presented herein invest in foreign securities which involve volatility and political, economic and currency risks and differences in accounting methods. These risks are greater for investments in emerging and frontier markets. Derivatives may involve certain costs and risks such as liquidity, interest rate, market and credit.
This communication may contain Index data from J.P. Morgan or data derived from such Index data. Index data information has been obtained from sources believed to be reliable but J.P. Morgan does not warrant its completeness or accuracy. The Index is used with permission. The Index may not be copied, used, or distributed without J.P. Morgan's prior written approval. Copyright 2025, J.P. Morgan Chase & Co. All rights reserved.
This communication may contain aggregate peer analysis data has been obtained from eVestment Alliance LLC and its affiliated entities (collectively, "eVestment"). eVestment reserves all rights, including to ownership and distribution. eVestment collects information directly from investment management firms and other sources believed to be reliable; however, eVestment does not guarantee or warrant the accuracy, timeliness, or completeness of the information provided and is not responsible for any errors or omissions. Performance results may be provided with additional disclosures available on eVestment’s systems and other important considerations such as fees that may be applicable. Not for general distribution. * All categories not necessarily included; Totals may not equal 100%. Copyright 2013‐2025 eVestment Alliance, LLC. Returns less than a year are not annualized.
While reasonable care has been taken to ensure that the information herein is factually correct, Global Evolution makes no representation or guarantee as to its accuracy or completeness. The information herein is subject to change without notice. Certain information contained herein has been provided by third party sources which are believed to be reliable, but accuracy and completeness cannot be guaranteed. Global Evolution does not guarantee the accuracy of information obtained from third party/other sources.
The information herein is not intended to provide, and should not be relied upon for, accounting, legal or tax advice or investment recommendations. This document does not constitute investment advice. The contents of this document represent Global Evolution's general views on certain matters, and is not based upon, and does not consider, the specific circumstance of any investor.
Legal Disclaimer ©2025 Global Evolution.
This document is copyrighted with all rights reserved. No part of this document may be distributed, reproduced, transcribed, transmitted, stored in an electronic retrieval system, or translated into any language in any form by any means without the prior written permission of Global Evolution, as applicable.
Copyright © 2026 Global Evolution - All rights reserved