Dear visitor
You tried to access but this page is only available for
You tried to access but this page is only available for


Edward Soekamto
Senior Portfolio Manager

Alexander Dahlberg
Senior Research Analyst
Introduction
EM Credit: Seen as one asset class, but are really two distinct opportunities – Sovereigns & Corporates
Many investors approach EM hard-currency debt primarily through sovereign bonds, often overlooking corporate credit. This bias reflects sovereigns’ greater liquidity, familiarity, and longer track record. Yet, while EM corporate credit has delivered comparable returns over time, it has historically produced a stronger risk-adjusted returns profile - making a compelling case for blending both asset classes in a well-diversified portfolio. At Global Evolution, we take a more balanced view. We see EM sovereign and corporate bonds as complementary building blocks within a broader hard-currency credit allocation. Although EM corporates are traditionally perceived as the “riskier” asset class when compared across equivalent risk segments in both investment-grade and high-yield buckets, they consistently demonstrate a more attractive risk–return profile than EM sovereign credit. By blending the two, we believe investors can meaningfully enhance income potential while keeping the overall risk profile largely unchanged.
EM Hard-Currency Sovereign & Corporate Credit: Often managed separately – but evidence shows superior results when combined
Complementary exposures: EM sovereign and corporate bonds offer different yet complementary sources of return. Sovereigns provide liquidity, frontier market exposure, and higher-beta upside, while corporates contribute higher-quality carry, lower volatility, and sector diversification.
Broader opportunity set: Combining the two segments expands the investable universe, offering both country-level exposure through sovereigns and a diversified issuer base across investment-grade and high-yield corporates.
Improved portfolio construction: EM corporates can enhance portfolio carry at comparable ratings, while sovereigns add higher-spread opportunities, resulting in a broader and more balanced spread distribution.
Different risk drivers: Both EM sovereign and corporate hard-currency bonds share the same primary global risk drivers, given their USD denomination. The key differentiator is their differing exposure to global interest-rate risk: sovereigns typically exhibit higher correlation to global rates due to longer duration, resulting in greater rate-driven volatility. In contrast, corporates generally feature shorter duration, translating into lower sensitivity to rate movements, while their more globally diversified business operations help mitigate country-specific risks.

Shared Drivers and Correlations
EM Sovereign & Corporate Credit: closely correlated, yet perfectly complementary
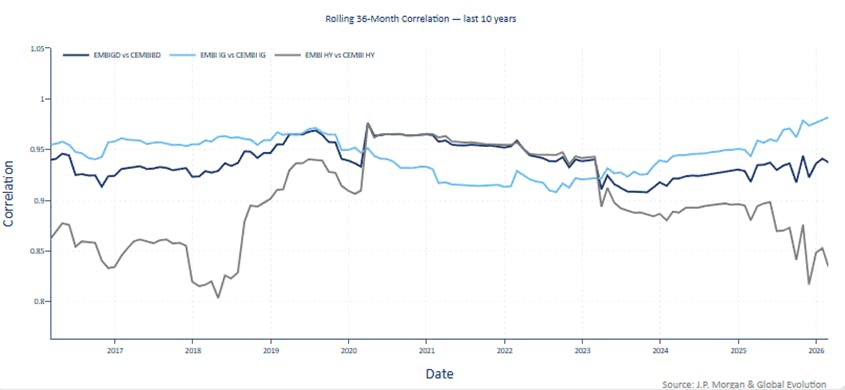
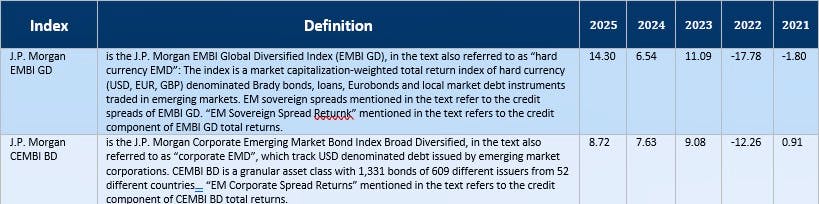
Over the past decade, rolling 36-month correlations between the EMBI GD (EM sovereign) and CEMBI BD (EM corporate) indices have remained consistently high, typically ranging between 0.85 and 0.97 across both investment grade and high yield segments, with correlations persistently above ~0.90.
This reflects their shared exposure to global macro drivers. However, sovereign bonds tend to be more volatile due to their longer duration, while corporates benefit from shorter duration and natural USD hedging, through USD revenues and active FX balance sheet management helping to mitigate country-specific risks. As a result, sovereign spreads typically react more sharply to changes in risk sentiment, whereas corporates tend to be more stable.
Structural Differences Between EM Corporate and Sovereign Indices
Both indices share similar average credit ratings, yet EM corporate debt delivers greater resilience thanks to shorter duration and a broader, more diversified issuer base, driving more balanced performance across the board.
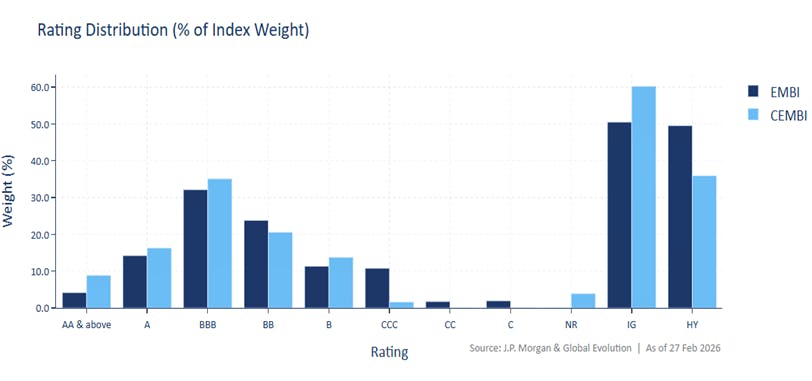
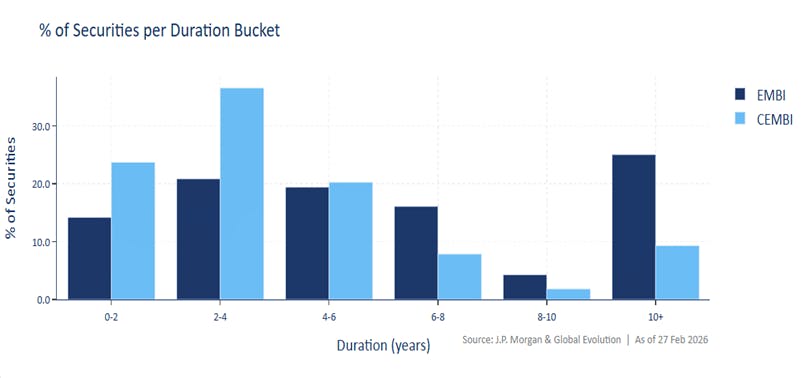
At first glance, the average credit quality of EM corporates (BBB-) and EM sovereigns (BBB-) appear broadly similar. However, a closer look at the rating and duration distribution reveals a meaningful structural divergence. EM sovereign indices carry a significantly larger allocation to lower-quality credit, with 24% exposed to debt rated B and CCC, nearly 10 percentage points more than EM corporate indices. This lower-quality skew, combined with the longer duration profile, with the EMBI averaging around 7.1 years compared with approximately 5.2 years for the CEMBI, tends to result in higher volatility and deeper drawdowns.
From a diversification perspective, the two asset classes also differ meaningfully in their regional composition. EM sovereign indices are more heavily concentrated in Latin America and EMEA, whereas EM corporate indices have a significantly larger allocation to Asia, reflecting the region’s deep and diversified corporate issuer base.
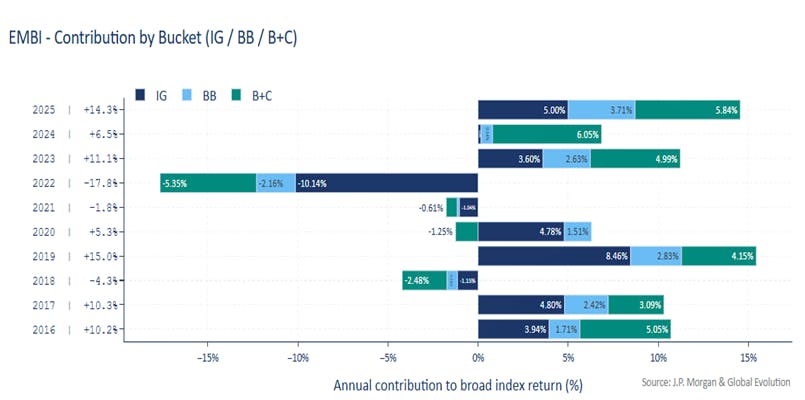
A key implication of this composition is that EMBI performance is more reliant on lower-rated segments. As illustrated below, the single-B and CCC buckets frequently account for a significant share of annual returns, typically around 30–40% in most years, highlighting the outsized role of higher-beta exposures.
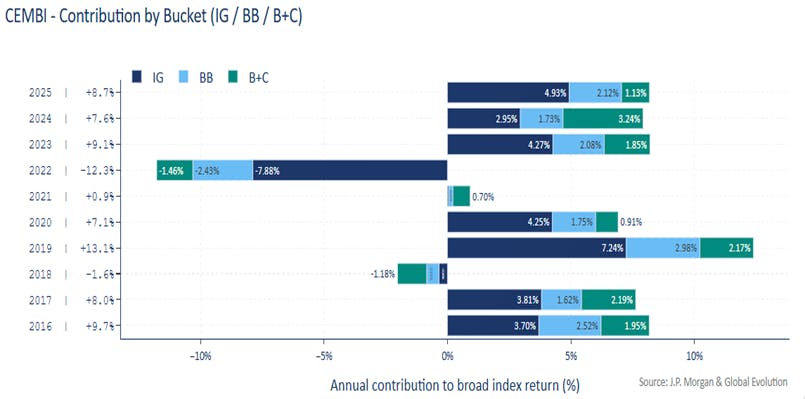
By contrast, CEMBI exhibits a more diversified return profile, with performance supported by a broader mix of issuers across sectors and rating categories. This reduces reliance on lower-rated, more idiosyncratic segments and tends to result in more stable and consistent performance across market environments, reinforcing the role of EM corporate credit as a complementary allocation within hard-currency portfolios.
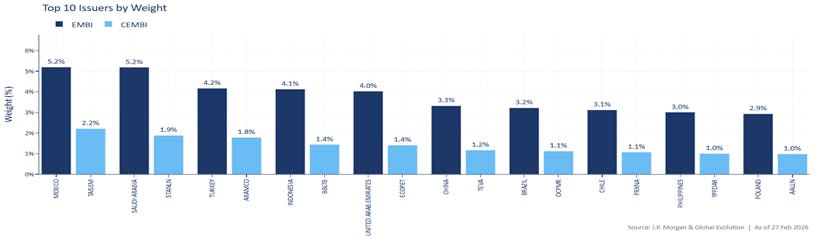
Furthermore, the corporate universe benefits from a much broader issuer base, with around 650 individual issuers, resulting in lower concentration risk, only 10 issuers carry an index weight above 1%. By contrast, approximately 38.7% of the EMBI index is concentrated across the top 10 countries, highlighting the higher concentration inherent in sovereign benchmarks.
The Combined Opportunity Set
Combining EM corporates and sovereigns broadens diversification while preserving country exposure, cuts volatility via shorter duration, boosts carry through corporate credit and delivers a more balanced spread profile.
EM corporate bond universe provides significantly greater scale than in the past, with approximately $1.19 trillion across roughly 726 issuers, compared with around $1.45 trillion and 68 countries in the EM sovereign universe. Combining sovereign and corporate exposure therefore enhances diversification relative to a sovereign-only allocation, while allowing investors to maintain similar country exposure, reduce portfolio volatility through shorter duration, and improve portfolio carry through corporate credit, an outcome that is often difficult to achieve using sovereign bonds alone.
Structurally, the CEMBI tends to be clustered around +/-5yr maturity buckets and concentrated around the 100-250bps spread buckets, reflecting its higher average credit quality, whereas the EMBI carries greater exposure to idiosyncratic and higher-spread risk, with a heavier allocation to single-B and CCC-rated issuers. When combined, the two universes create a more balanced spread distribution across a combined portfolio.
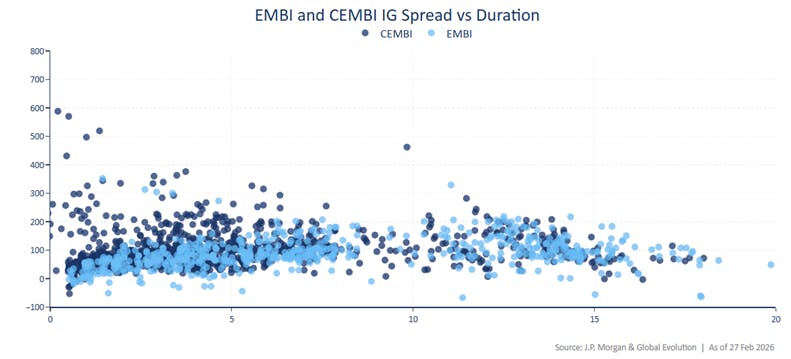
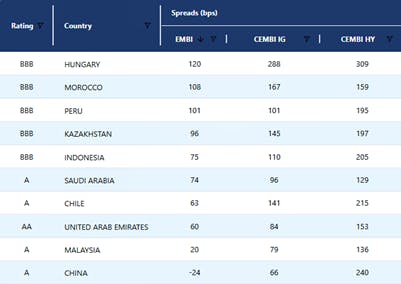
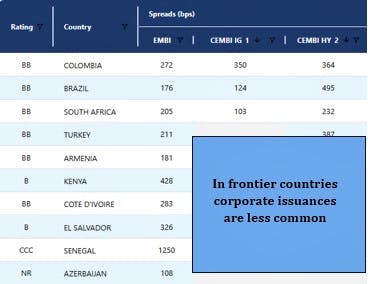
This dynamic is particularly evident in large investment-grade EM markets such as Mexico and Brazil, where sovereign spreads are often relatively tight, while corporate issuers can offer meaningful spread pickup at comparable credit quality. By contrast, in high yield and frontier EMBI countries, corporate issuance is scarce or nonexistent, leaving sovereigns as the only real way to express a country view.
Spread Returns and Risk Compensation
CEMBI and EMBI deliver similar long-term returns, yet CEMBI stands out with greater stability, superior risk-adjusted performance, and significantly smaller drawdowns.
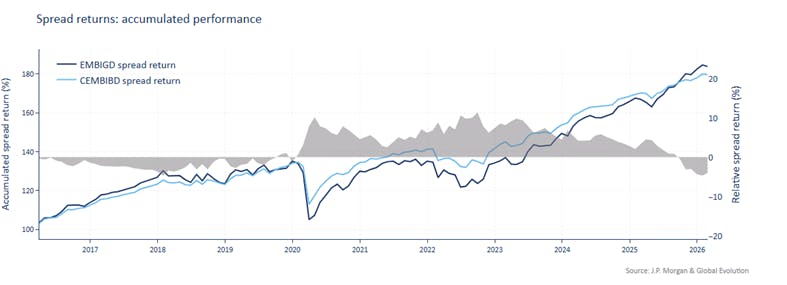
Over the long term, the performance of the EMBI and CEMBI indices has been broadly similar, although the EMBI universe has exhibited materially higher volatility. As shown in the chart below, when focusing on spread performance and excluding the impact of interest-rate movements, CEMBI has delivered a more stable return profile, with higher risk-adjusted returns and smaller drawdowns. This has been particularly evident over the past decade, during which CEMBI spread returns have consistently outperformed EMBI.
The combination of shorter duration, stronger fundamentals, and a broader issuer base has made corporates more resilient during periods of market stress, including the episodes seen over the past five years. By contrast, sovereign spreads, especially in high yield are generally more volatile, but can offer meaningful upside when idiosyncratic risk drivers play out.
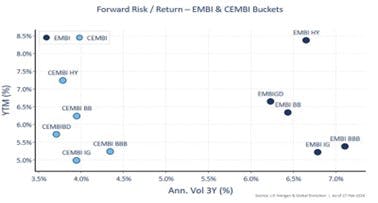
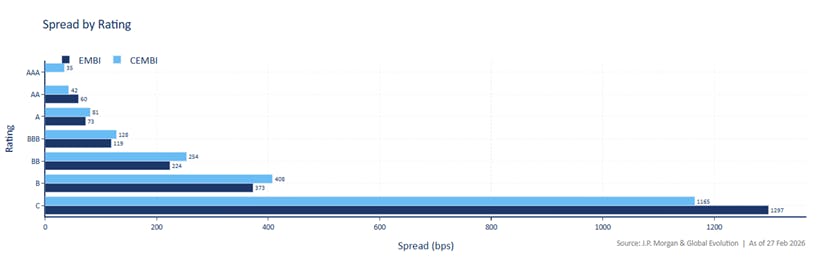
Across the investment-grade segments, spreads are broadly similar, although EM corporates typically offer slightly higher spreads than sovereigns at comparable ratings. The divergence becomes more pronounced within the HY segment. In the BB and B segments, corporates continue to offer meaningfully higher spreads than sovereigns. At the CCC level, however, sovereigns trade at significantly wider spreads than corporates, reflecting greater idiosyncratic risk. As discussed, this segment can act as a key, and at times outsized, driver of overall index performance, given its relatively large weight.
The Case for the Combined Portfolio
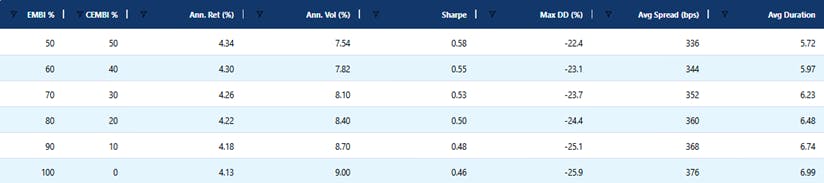
Adding up to 50% EM corporates to a pure sovereign portfolio consistently shifts the efficient frontier outward, delivering higher returns for the same risk or lower volatility for the same return, powered by sovereign convexity and corporate carry/stability.
To quantify the benefits of adding corporates to a sovereign portfolio, we construct efficient frontiers starting from a 100% EMBI allocation and gradually introducing CEMBI up to 50%. Across this range, corporate exposure consistently improves the efficient frontier, either reducing volatility for a given return or increasing returns for a given level of risk, with results holding across both investment-grade and high-yield segments.
A key driver is the duration asymmetry between the two segments. Sovereigns provide convexity and tend to outperform in risk-on environments as spreads tighten, while corporates contribute stable carry and lower volatility, helping anchor portfolio returns across market conditions.
Disclaimer & Important Disclosures
Global Evolution Asset Management A/S (“GEAM”) is incorporated in Denmark and authorized and regulated by the Danish FSA (Finanstilsynet). GEAM DK is located at Buen 11, 2nd Floor, Kolding 6000, Denmark.
GEAM has a United Kingdom branch (“Global Evolution Asset Management A/S (London Branch)”) located at Level 8, 24 Monument Street, London, EC3R 8AJ, United Kingdom. This branch is authorized and regulated by the Financial Conduct Authority under FCA # 954331. In Canada, while GEAM has no physical place of business, it has filed to claim the international dealer exemption and international adviser exemption in Alberta, British Columbia, Ontario, Quebec and Saskatchewan.
In the United States, investment advisory services are offered through Global Evolution USA, LLC (‘Global Evolution USA”), a Securities and Exchange Commission (“SEC”) registered investment advisor. Global Evolution USA is located at: 250 Park Avenue, 15th floor, New York, NY. Global Evolution USA is a wholly owned subsidiary of Global Evolution Financial ApS, the holding company of GEAM. Portfolio management and investment advisory services are provided to GE USA clients by GEAM. GEAM is exempt from SEC registration as a “participating affiliate” of Global Evolution USA as that term is used in relief granted by the staff of the SEC allowing U.S. registered investment advisers to use investment advisory resources of non-U.S. investment adviser affiliates subject to the regulatory supervision of the U.S. registered investment adviser. Registration with the SEC does not imply any level of skill or expertise. Prior to making any investment, an investor should read all disclosure and other documents associated with such investment including Global Evolution’s Form ADV which can be found at https://adviserinfo.sec.gov.
In Singapore, Global Evolution Fund Management Singapore Pte. Ltd (“Global Evolution Singapore”) has a Capital Markets Services license issued by the Monetary Authority of Singapore for fund management activities. It is located at Level 39, Marina Bay Financial Centre Tower 2, 10 Marina Boulevard, Singapore 018983.
GEAM, Global Evolution USA, and Global Evolution Singapore, together with their holding companies, Global Evolution Financial Aps and Global Evolution Holding Aps, make up the Global Evolution group affiliates (“Global Evolution”).
Global Evolution, Conning, Inc., Goodwin Capital Advisers, Inc., Conning Investment Products, Inc., a FINRA-registered broker-dealer, Conning Asset Management Limited, Conning Asia Pacific Limited, Octagon Credit Investors, LLC, and Pearlmark Real Estate, L.L.C. and its subsidiaries are all direct or indirect subsidiaries of Conning Holdings Limited (collectively, “Conning”) which is one of the family of companies whose controlling shareholder is Generali Investments Holding S.p.A. (“GIH”) a company headquartered in Italy. Assicurazioni Generali S.p.A. is the ultimate controlling parent of all GIH subsidiaries. Conning has investment centers in Asia, Europe and North America.
Conning, Inc., Conning Investment Products, Inc., Goodwin Capital Advisers, Inc., Octagon Credit Investors, LLC, PREP Investment Advisers, L.L.C. and Global Evolution USA, LLC are registered with the SEC under the Investment Advisers Act of 1940 and have noticed other jurisdictions they are conducting securities advisory business when required by law. In any other jurisdictions where they have not provided notice and are not exempt or excluded from those laws, they cannot transact business as an investment adviser and may not be able to respond to individual inquiries if the response could potentially lead to a transaction in securities.
Conning, Inc. is also registered with the National Futures Association. Conning Investment Products, Inc. is also registered with the Ontario Securities Commission. Conning Asset Management Limited is Authorised and regulated by the United Kingdom's Financial Conduct Authority (FCA#189316); Conning Asia Pacific Limited is regulated by Hong Kong’s Securities and Futures Commission for Types 1, 4 and 9 regulated activities; Global Evolution Asset Management A/S is regulated by Finanstilsynet (the Danish FSA) (FSA #8193); Global Evolution Asset Management A/S (London Branch) is regulated by the United Kingdom's Financial Conduct Authority (FCA# 954331); Global Evolution Asset Management A/S, Luxembourg branch, registered with the Luxembourg Company Register as the Luxembourg branch(es) of Global Evolution Asset Management A/S under the reference B287058. It is also registered with the CSSF under the license number S00009438. Conning primarily provides asset management services for third-party assets.
This publication is for informational purposes and is not intended as an offer to purchase any security. Nothing contained in this communication constitutes or forms part of any offer to sell or buy an investment, or any solicitation of such an offer in any jurisdiction in which such offer or solicitation would be unlawful.
All investments entail risk, and you could lose all or a substantial amount of your investment. Past performance is not indicative of future results which may differ materially from past performance. The strategies presented herein invest in foreign securities which involve volatility and political, economic and currency risks and differences in accounting methods. These risks are greater for investments in emerging and frontier markets. Derivatives may involve certain costs and risks such as liquidity, interest rate, market, and credit.
The Agent of Capital Strategies Partners in respect of the placement of Global Evolution Frontier Markets in the United States is Marco Polo Securities Inc, a non-affiliated broker-dealer registered with the US Securities and Exchange Commission. The activities of Capital Strategies Partners in the United States, including the distribution of Indicative Term Sheets, will be effected only to the extent permitted by Rule 15a-6 under the US Securities Exchange Act of 1934 and in accordance with the Services Agreement entered into between Capital Strategies Partners and Marco Polo Securities Inc with respect thereto. Marco Polo Securities Inc. is a FINRA registered broker-dealer (CRD# 46561) formed for that purpose in the State of New York with its principal office at 1230 Avenue of the Americas, 16th floor, New York, New York, 10020. Contact at Marco Polo Securities is clientservices@mpsecurities.com ; 1-347-745-6448.
While reasonable care has been taken to ensure that the information herein is factually correct, Global Evolution makes no representation or guarantee as to its accuracy or completeness. The information herein is subject to change without notice. Certain information contained herein has been provided by third party sources which are believed to be reliable, but accuracy and completeness cannot be guaranteed. Global Evolution does not guarantee the accuracy of information obtained from third party/other sources.
The information herein is not intended to provide, and should not be relied upon for, accounting, legal or tax advice or investment recommendations.
Legal Disclaimer ©2026 Global Evolution.
This document is copyrighted with all rights reserved. No part of this document may be distributed, reproduced, transcribed, transmitted, stored in an electronic retrieval system, or translated into any language in any form by any means without the prior written permission of Global Evolution, as applicable.
Copyright © 2026 Global Evolution - All rights reserved