Dear visitor
You tried to access but this page is only available for
You tried to access but this page is only available for


Romain Bocket
Senior Portfolio Manager

Alexander Dahlberg
Senior Research Analyst
As an asset manager dedicated to Emerging and Frontier Markets fixed income since 2007, Global Evolution provides portfolio solutions allowing global investors to access every subset of this investment universe. The company manages over $18bn across various strategies, including ~$3bn in IG corporates.
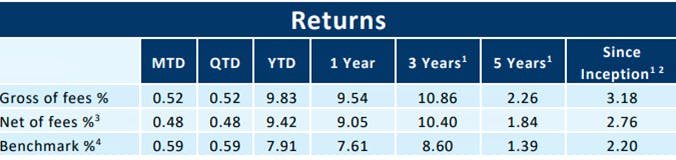
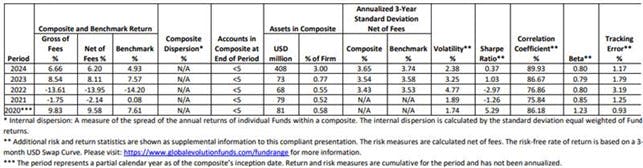
At the end of October 2025, our EM IG Corporate debt Composite is leading its peer group over the YTD, 1yr, 2yrs and 3yrs periods, with annualized excess return over the 3yrs period of 226bps gross / 180bps net (see appendix for full composite track record), demonstrating the opportunities for active managers within this part of the EM fixed-income universe.
Summary
EM IG corporates offer a persistent and under-utilized source of diversification and return enhancement for Global IG bond portfolios. EM IG corporates’ spreads remain structurally wider than in developed markets (DM) despite offering stronger balance sheets, and operating in countries with better growth prospects, lower debt, and better demographic trends.
With over 400 issuers in 35 countries and more than $1 trillion of bonds outstanding, EM IG corporate asset class offers substantial internal diversification and liquidity. Individual country or issuer risks are diversified away but their spread premium remains, making it the perfect addition to a portfolio of US IG bonds.
Historically, EM IG corporates have delivered higher risk-adjusted returns, smaller drawdowns, and better return/volatility ratio than US IG corporates. An efficient-frontier analysis confirms the practical implication: incorporating EM IG corporates into a US IG bond portfolio shifts the frontier outward, enabling higher returns and lower volatility. The diversification benefit is robust across lookback horizons.
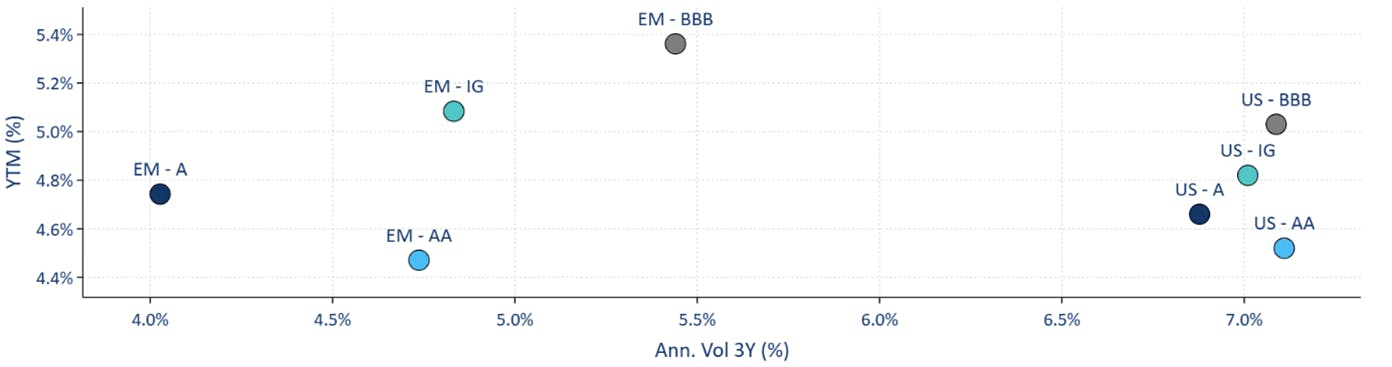
Looking forward, the case for EM IG remains, with higher yield to maturity (YTM) and lower volatility across rating buckets. This supports their inclusion as a strategic allocation alongside US IG bonds in global fixed-income portfolios.
Introduction
EM IG corporate bonds have become an increasingly global asset class, yet portfolio allocations remain heavily skewed toward developed markets. At the same time, EM IG corporate bond universe has grown significantly in both size and depth, offering exposure to diversified economic and credit cycles, conservative balance sheets, and, as this paper argues, a persistent structural risk premium that is not justified by fundamentals.
This paper presents empirical evidence that EM IG corporates provide:
Wider spreads than US IG
Lower leverage, and higher compensation per unit of leverage,
Lower historical volatility,
Stronger risk-adjusted returns,
Attractive forward-looking Sharpe ratios when combining current yields with realized volatility.
Together, these results illustrate why EM IG corporates deserve a strategic role in global Credit portfolios.
Data Sources
EM IG data sourced from the JP Morgan CEMBI IG composite (returns, yields, duration).
US IG data sourced from ICE/BofA indices.
All return series are converted to monthly returns.
All data as of October 2025 month-end, unless stated otherwise.
Analysis
Fundamentals - EM IG credit demonstrates credit quality on par with or better than US IG, underpinned by resilient fundamentals and improving trends.
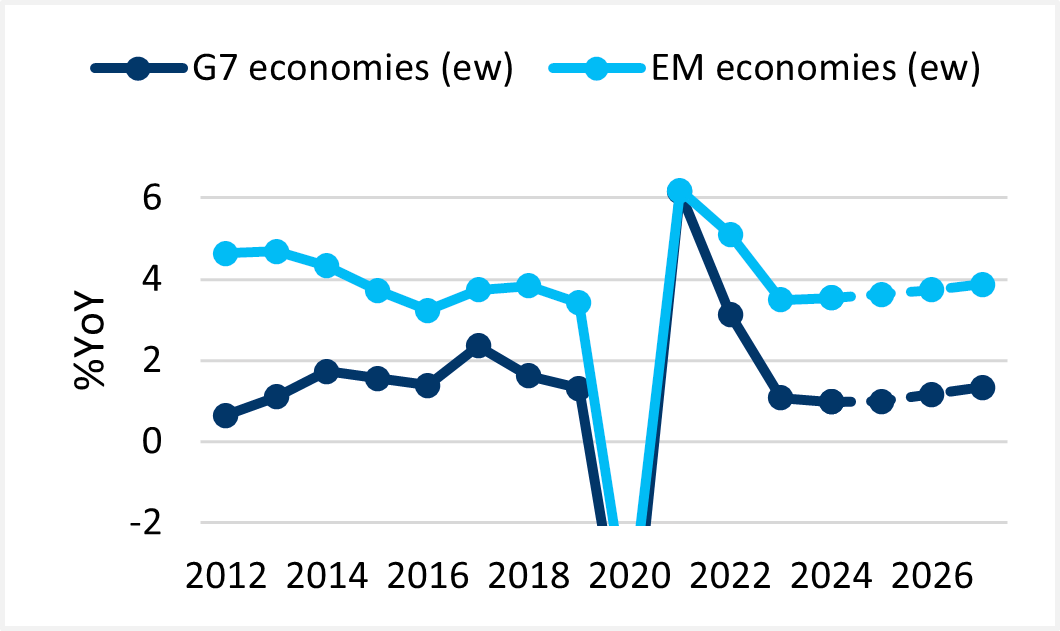
Emerging economies operate under a macroeconomic backdrop that is fundamentally different compared to developed markets. Over the past decade, EM countries have delivered higher trend growth, and lower public-debt burdens than their DM counterparts. This divergence has accelerated in the post-pandemic period.
Global real GDP growth is forecasted at 3.2% for 2025 (source: OECD), driven largely by emerging markets, which have shown resilient services activity, diversified exports, and lower inflation despite volatile macro headwinds.
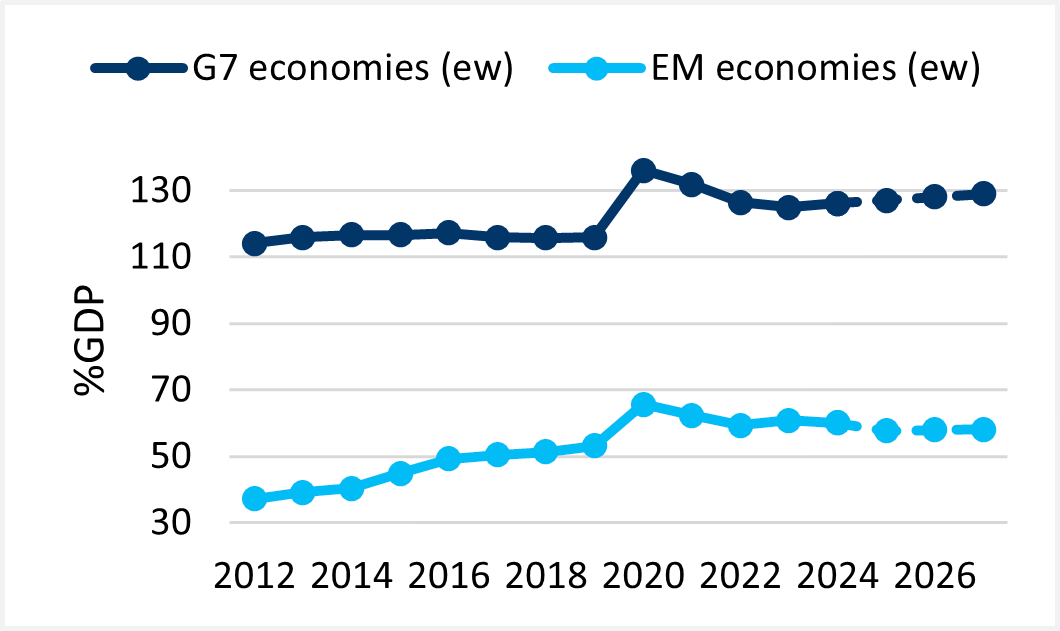
On average, EM sovereigns exhibit significantly lower debt-to-GDP ratios, providing them with greater fiscal room, healthier budget trajectories, and more capacity to support domestic credit markets in periods of stress. In contrast, most developed nations are now running historically elevated debt levels and persistent primary deficits, reducing their fiscal flexibility. This is accentuated by the aging of their population, a phenomenon which most EM countries are not experiencing.
Capital markets in EM are growing even faster than their economies, and the demand dynamic for EM bonds is increasingly shifting from international to local, providing more resilient and less volatile markets. From Asian insurers to Middle Eastern sovereign wealth funds and Latin American pension funds, the local bid is becoming the main driver of EM technicals and improves liquidity.
In addition to exposure to the fastest growing economies and the emergence of a global consumer middle class, EM IG corporates also benefit from secular trends in technological developments and increasing demand for commodities.
From the world’s largest Oil & Gas producers enjoying the lowest lifting costs (e.g. Saudi Aramco, Adnoc, Qatar Energy) to copper producers controlling 80% of the world’s reserves (e.g. Southern Copper, Freeport Indonesia, Codelco), the combination of resources and cost curve advantages makes EM IG issuers a cornerstone of the world’s economy.
While SQM from Chile leads the world’s production of lithium, industrial chemicals, specialty plant nutrition, and iodine, Moroccan based OCP enjoys an asset base which includes 70% of the world’s phosphate estimated reserves. Other EM IG companies lead the world in the production of iron ore, silver, pulp and paper, proteins, but also EV batteries, and semiconductors.
The underlying economic momentum in emerging markets outstrips that of the US, providing a supportive backdrop for EM IG credit performance.
The combination of stronger trend growth, healthier sovereign balance sheets, deepening capital markets and younger populations contributes to more resilient EM corporate credit behavior than traditional market narratives imply. In 2025, EM sovereign upgrades have outpaced downgrades despite macroeconomic challenges, signaling strengthening credit profiles, while US IG has seen limited downgrades but faces pressures from fiscal policy uncertainties.
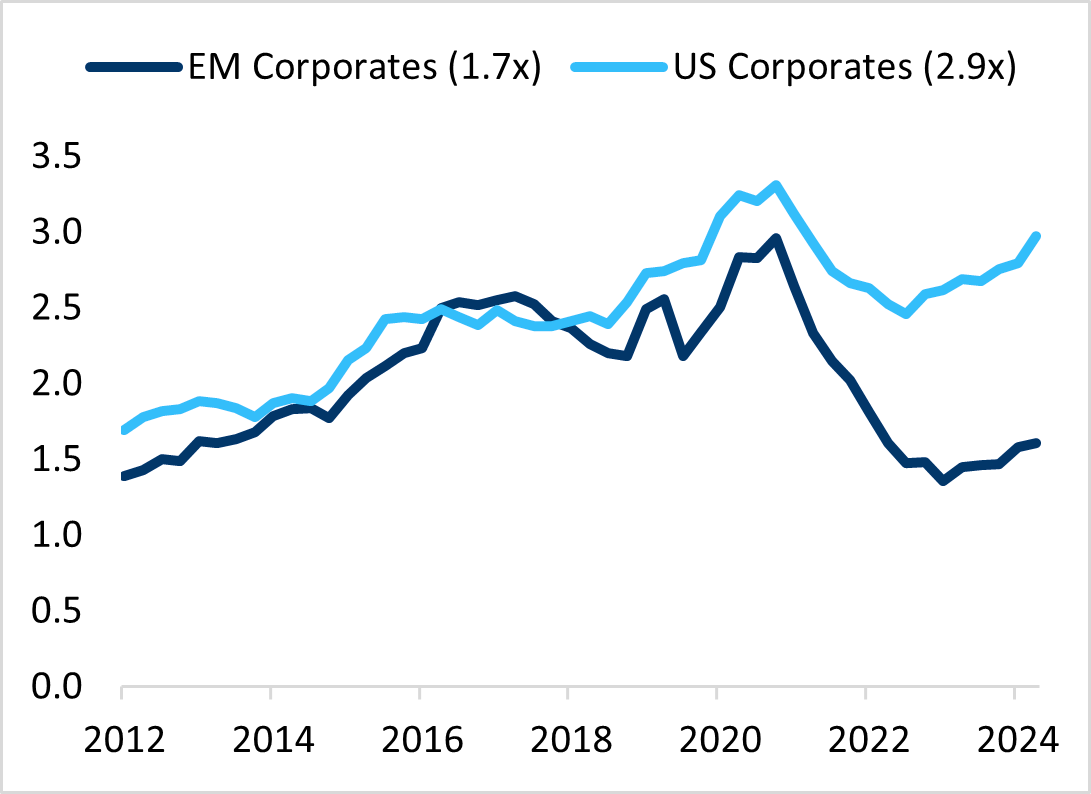
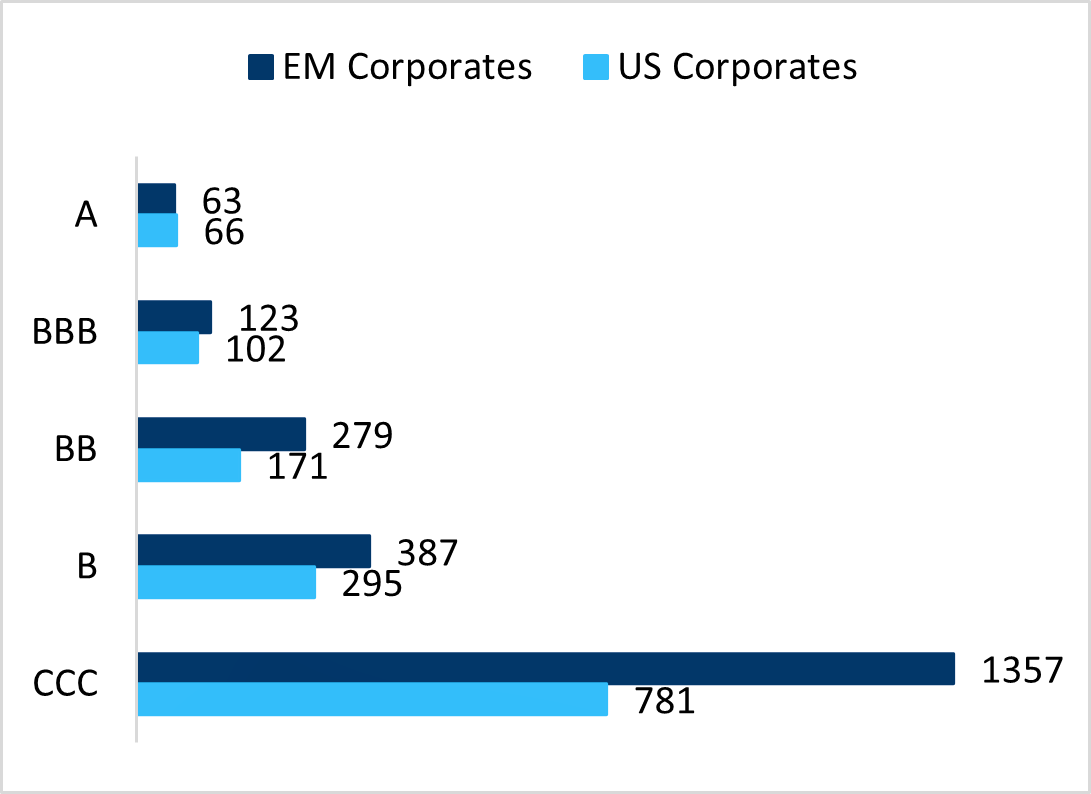
A core premise in global credit markets is that spreads should broadly compensate investors for fundamental risks, especially leverage and default probability. Yet EM IG corporates differ materially from US IG issuers on several key balance-sheet metrics. In many sectors, EM companies run lower leverage, hold higher cash balances, and maintain more conservative capital structures than their US peers.
Despite this, spreads remain systematically wider in EM IG across almost the entire rating spectrum. This disparity is not episodic; it persists across time horizons, market cycles, and sector compositions.
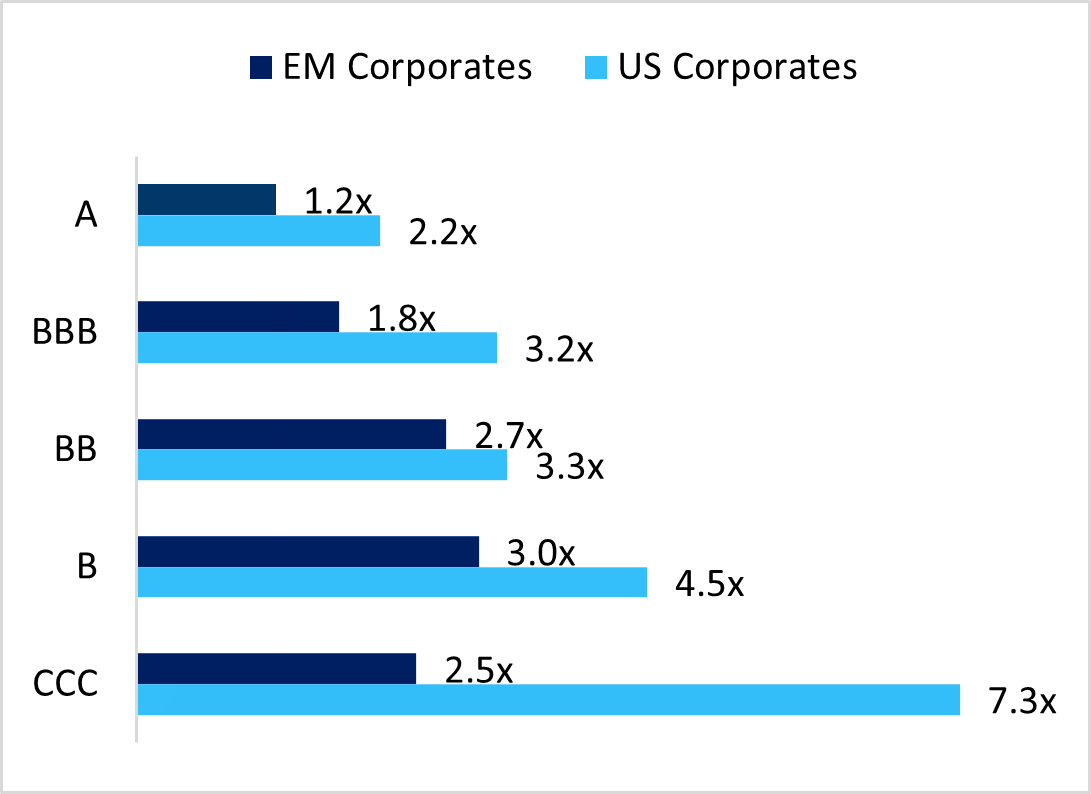
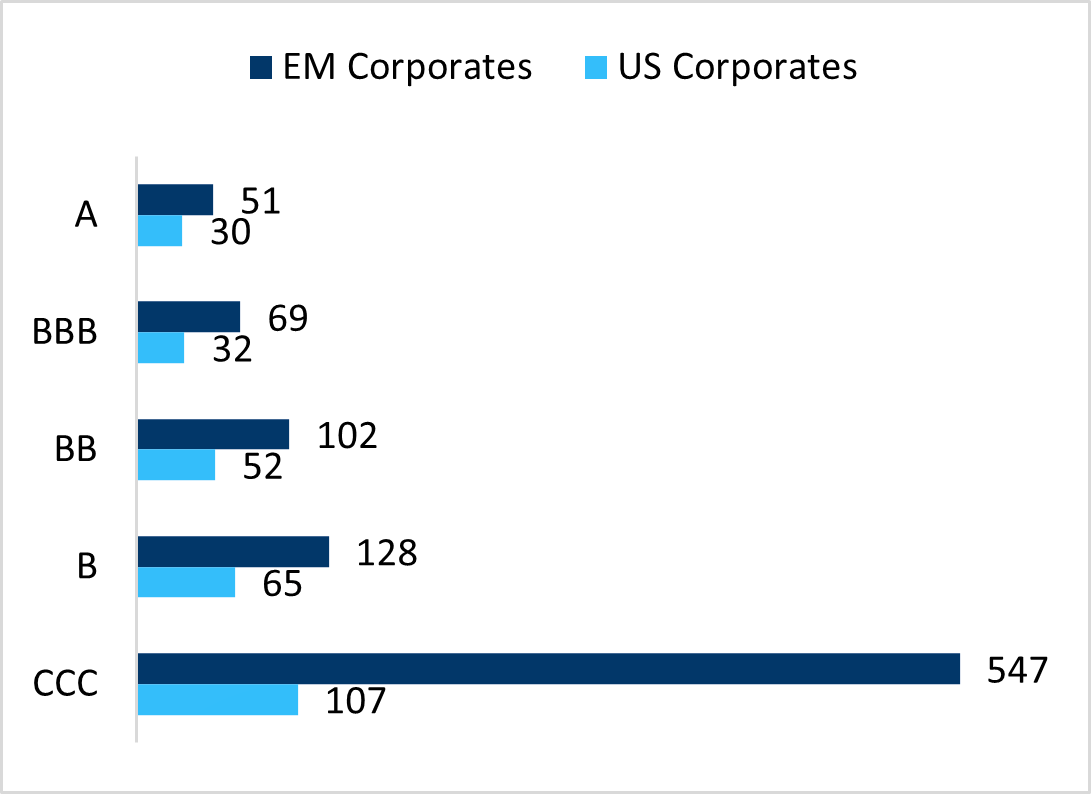
Assessing spreads relative to issuer leverage provides a clean, intuitive measure of compensation for balance-sheet risk. When spreads are normalized by net leverage (“spread per turn of leverage”), the results are consistent and striking:
EM IG provides materially higher compensation per unit of leverage than US IG, often by a wide margin, for all rating buckets.
EM IG provides materially higher spread per rating bucket (The single-A bucket is the only partial deviation, largely due to their much lower leverage).
EM IG corporates embed a risk premium that is not justified by fundamentals alone. Instead, the premium reflects historical, outdated perceptions of EM risk, and a persistent under allocation by global investors.
Risk/Return Analysis – In the last 10 years EM IG corporate bonds have shown superior annualised volatility-adjusted returns compared to US IG indices, with shorter durations (over two years less than US corporates) reducing interest rate sensitivity.
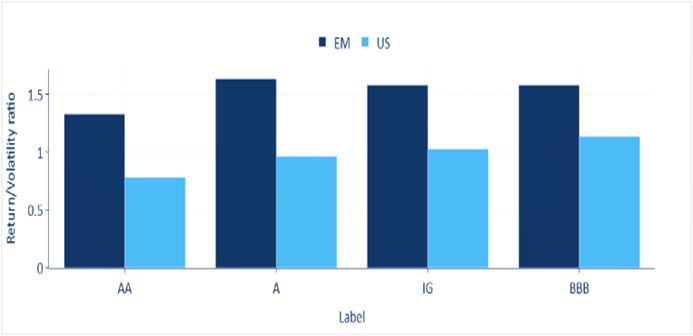
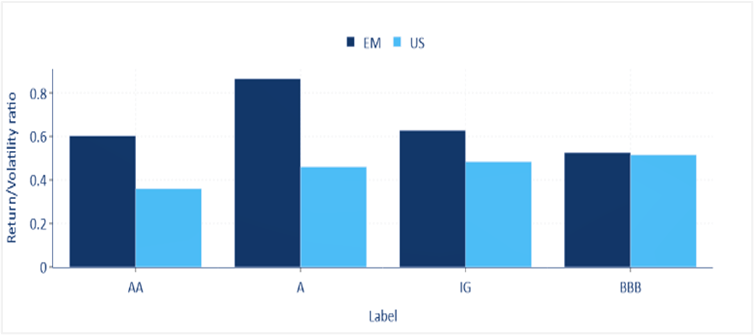
Historical Return/Volatility ratios provide a clear window into realised risk-adjusted performance across market cycles. To evaluate performance empirically, we examine annualised returns, volatility, and Return/Volatility ratios over several horizons (3 and 10yrs).
Looking at the 3yrs and 10yrs Return/Volatility ratios across rating buckets the overall picture is a stronger ratio for EM IG corporates vs. US IG corporates.
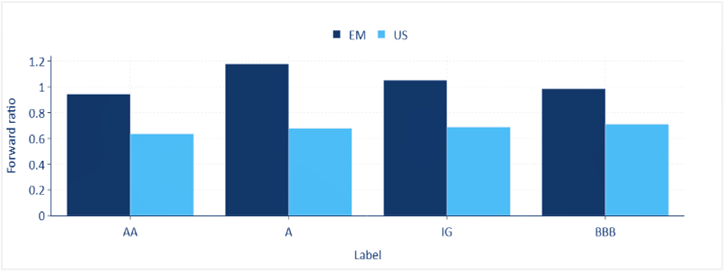
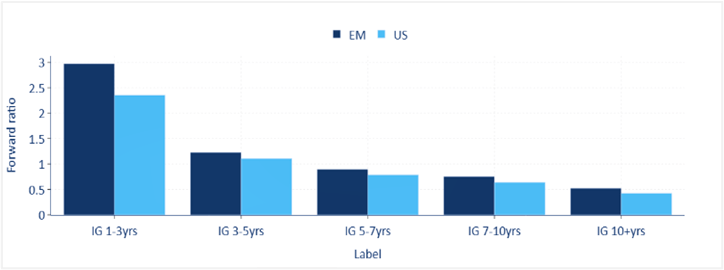
Historical Return/Volatility ratios are backward-looking by construction. To complement them, we introduce a forward-looking risk adjusted return ratio, defined as “Yield-To-Maturity / 3yr annualized volatility”.
This measure answers a simple question: Given today’s yields and recent volatility trends, which market offers the more attractive, expected risk-return tradeoff?
The conclusions are unambiguous:
Across every rating and duration bucket, forward ratios of EM IG corporates exceed those of US IG corporates.
EM IG corporates often deliver substantially higher expected returns per unit of volatility. This holds even when controlling for duration differences.
In short, if current yields are a reasonable predictor of medium-term returns, EM IG corporates offer a superior forward risk-return profile.
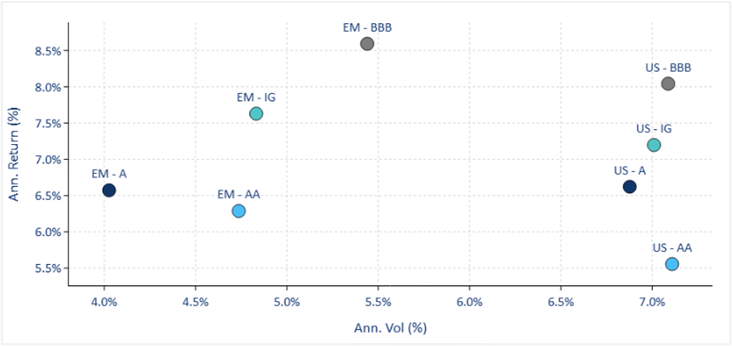
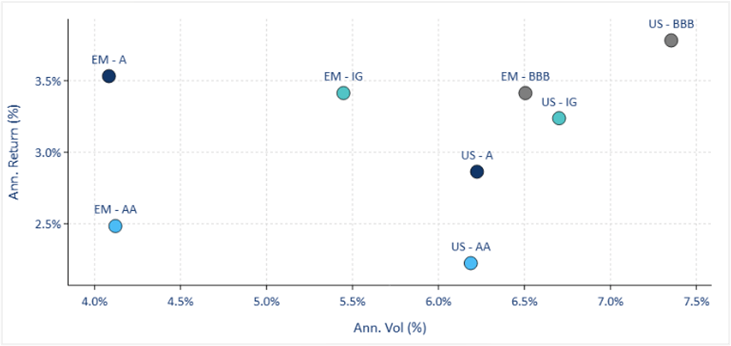
For equivalent volatility levels, EM IG historically offers higher annualized returns.
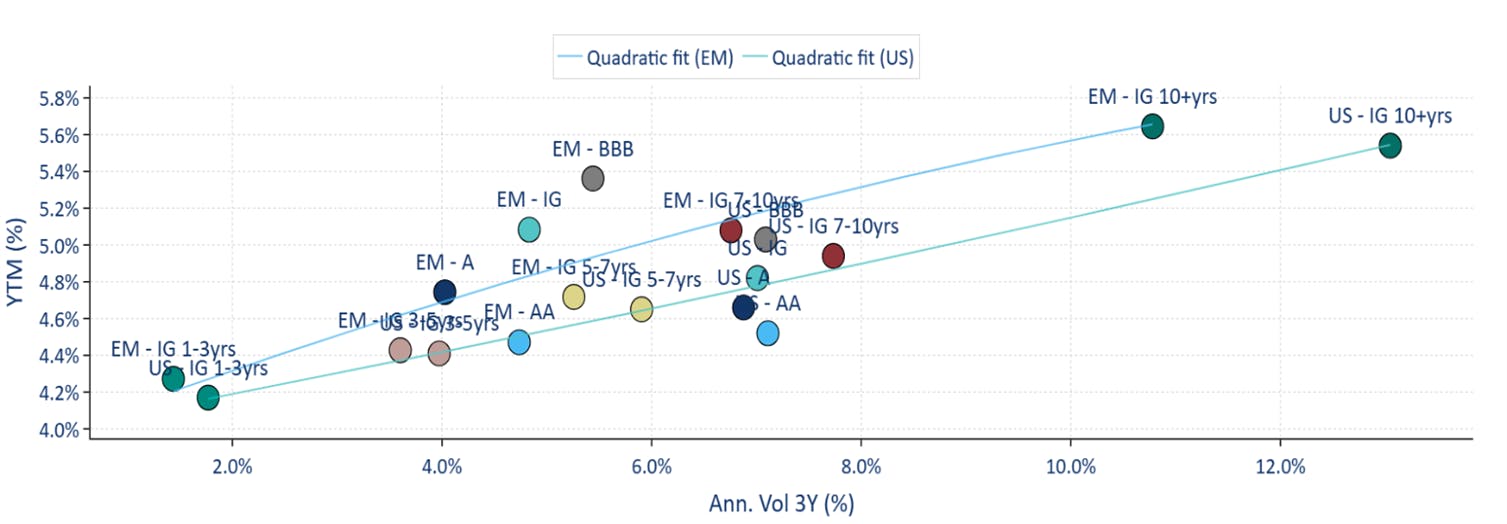
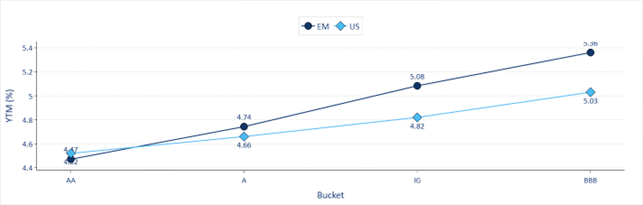
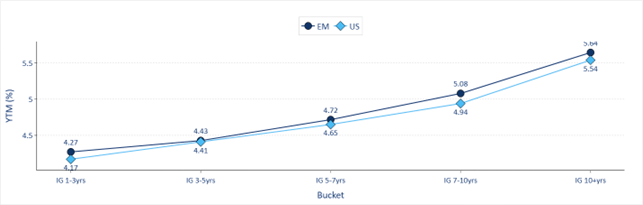
YTM Per rating and duration bucket
Analyzing YTM across both rating and duration segments shows a clear and persistent premium in favour of EM IG. EM yields exceed US yields in nearly every maturity bucket. This yield premium persists even for comparably rated debt: EM IG bonds often deliver higher yields than U.S. counterparts due market inefficiency and investor unfamiliarity. The only exception is the AA segment.
Moving down the credit spectrum, the yield advantage becomes increasingly pronounced. The EM BBB bucket offers a markedly higher yield premium, despite EM BBB issuers typically carrying lower leverage than their US peers.
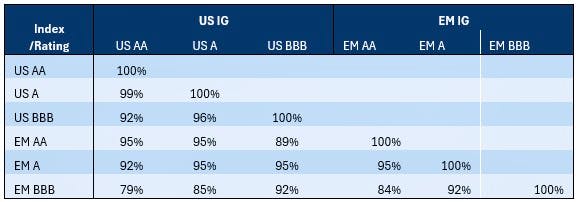
Cross-Market Correlation Analysis - Incorporating EM IG credit into a portfolio offers substantial diversification benefits, reducing overall risk in ways U.S. IG cannot match.
Understanding correlation patterns across markets is crucial for portfolio construction. We compute correlations between EM and US IG returns across both rating buckets.
The diversification benefit within US IG rating and duration bucket is relatively low: for example, US BBB’s have a correlation of 92% with US AA’s over the last 10yrs, and 96% with US single A’s. EM BBBs correlation to US AA’s and single A’s is much lower (79% and 85% respectively), providing around 3 times more diversification effect.
Within EM rating buckets, correlations are also lower than within US rating buckets: this demonstrates that EM IG corporate debt is a more diverse asset class than the US IG corporate debt and provides more opportunities for active managers.
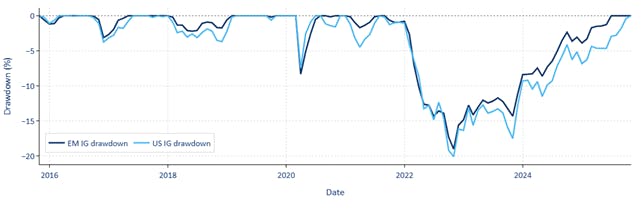
Drawdown Behavior
When examining the drawdown picture, EM IG corporates generally have lower drawdowns and faster recoveries. This is partially explained by the higher intra asset class diversification and the lower duration of the asset class.
This strengthens the case for EM IG as a complementary allocation: It provides higher returns without imposing structurally higher downside risk.
Efficient Frontier Analysis
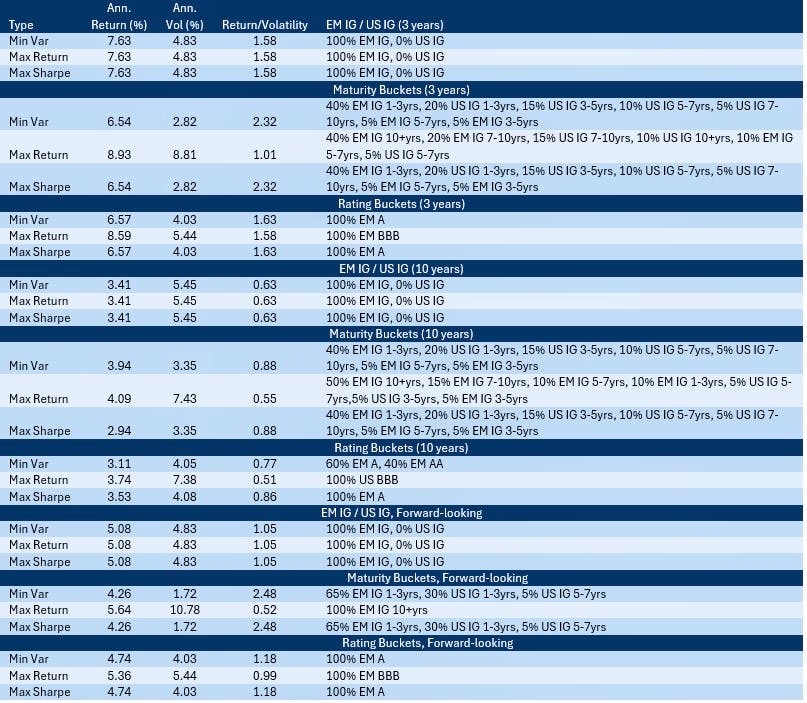
To quantify the practical implications of integrating EM IG into a global credit allocation, we construct a series of efficient frontiers.
The frontier analysis demonstrates that EM IG corporates consistently expand the opportunity set for a US IG investor. Blended portfolios combining EM and US IG corporates frequently improve upon the US-only frontier, delivering higher expected returns for a given level of volatility.This finding is driven by three empirical features: the higher structural yield of the EM IG corporates asset class, its lower volatility, and the imperfect correlation between EM and US credit.Thus, the efficient-frontier exercise illustrates a central result of this paper: historical data supports incorporating EM IG as a core component of investment-grade credit allocations, enhancing return potential while reducing volatility and improving portfolio diversification.
In a 2 assets (EM IG and US IG) efficient frontier framework, the optimal portfolio in terms of return/volatility ratio is 100% EM IG, as EM IG provides both the highest return and the lowest volatility, in 3yrs, 10yrs, and forward-looking horizons.
Looking at EM IG and US IG by maturity buckets, the optimal portfolios to maximize the return/volatility ratio, minimize the volatility or maximize the return have in every case at least 50% allocation to EM, on 3 years, 10 years and forward-looking horizons.
If instead we split the EM and US IG universes by rating buckets, in almost all cases the optimal portfolio to maximize the return/volatility ratio, minimize the volatility or maximize the return have 100% allocation to EM, on 3 years, 10 years and forward-looking horizons.’
Figure 18 provides the results of the efficient frontier analysis over the different periods and subindex categories.
Conclusion
The empirical evidence presented here makes a compelling case for the inclusion of EM IG corporates within US IG corporate bond portfolios. The market offers:
Stronger balance sheets
Consistently wider spreads
Superior spread per unit of leverage
Better returns
Lower volatility and drawdowns
Diversification benefits that persist across market cycles
Attractive risk-adjusted ratios, especially on a forward-looking basis.
Access to the world’s leading companies in strategic sectors.
EM IG credits trade wider than their underlying fundamentals warrant. For investors willing to reconsider historical biases, they represent not just a tactical opportunity, but a strategic source of persistent excess return, allowing them to outperform peers in absolute terms but also on a risk adjusted basis, while increasing diversification.
Disclaimer & Important Disclosures
Global Evolution Asset Management A/S (“GEAM”) is incorporated in Denmark and authorized and regulated by the Danish FSA (Finanstilsynet). GEAM DK is located at Buen 11, 2nd Floor, Kolding 6000, Denmark.
GEAM has a United Kingdom branch (“Global Evolution Asset Management A/S (London Branch)”) located at Level 8, 24 Monument Street, London, EC3R 8AJ, United Kingdom. This branch is authorized and regulated by the Financial Conduct Authority under FCA # 954331. In Canada, while GEAM has no physical place of business, it has filed to claim the international dealer exemption and international adviser exemption in Alberta, British Columbia, Ontario, Quebec and Saskatchewan.
In the United States, investment advisory services are offered through Global Evolution USA, LLC (‘Global Evolution USA”), a Securities and Exchange Commission (“SEC”) registered investment advisor. Global Evolution USA is located at: 250 Park Avenue, 15th floor, New York, NY. Global Evolution USA is a wholly owned subsidiary of Global Evolution Financial ApS, the holding company of GEAM. Portfolio management and investment advisory services are provided to GE USA clients by GEAM. GEAM is exempt from SEC registration as a “participating affiliate” of Global Evolution USA as that term is used in relief granted by the staff of the SEC allowing U.S. registered investment advisers to use investment advisory resources of non-U.S. investment adviser affiliates subject to the regulatory supervision of the U.S. registered investment adviser. Registration with the SEC does not imply any level of skill or expertise. Prior to making any investment, an investor should read all disclosure and other documents associated with such investment including Global Evolution’s Form ADV which can be found at https://adviserinfo.sec.gov.
In Singapore, Global Evolution Fund Management Singapore Pte. Ltd (“Global Evolution Singapore”) has a Capital Markets Services license issued by the Monetary Authority of Singapore for fund management activities. It is located at Level 39, Marina Bay Financial Centre Tower 2, 10 Marina Boulevard, Singapore 018983.
GEAM, Global Evolution USA, and Global Evolution Singapore, together with their holding companies, Global Evolution Financial Aps and Global Evolution Holding Aps, make up the Global Evolution group affiliates (“Global Evolution”).
Global Evolution, Conning, Inc., Goodwin Capital Advisers, Inc., Conning Investment Products, Inc., a FINRA-registered broker-dealer, Conning Asset Management Limited, Conning Asia Pacific Limited, Octagon Credit Investors, LLC, and Pearlmark Real Estate, L.L.C. and its subsidiaries are all direct or indirect subsidiaries of Conning Holdings Limited (collectively, “Conning”) which is one of the family of companies whose controlling shareholder is Generali Investments Holding S.p.A. (“GIH”) a company headquartered in Italy. Assicurazioni Generali S.p.A. is the ultimate controlling parent of all GIH subsidiaries. Conning has investment centers in Asia, Europe and North America.
Conning, Inc., Conning Investment Products, Inc., Goodwin Capital Advisers, Inc., Octagon Credit Investors, LLC, PREP Investment Advisers, L.L.C. and Global Evolution USA, LLC are registered with the SEC under the Investment Advisers Act of 1940 and have noticed other jurisdictions they are conducting securities advisory business when required by law. In any other jurisdictions where they have not provided notice and are not exempt or excluded from those laws, they cannot transact business as an investment adviser and may not be able to respond to individual inquiries if the response could potentially lead to a transaction in securities.
Conning, Inc. is also registered with the National Futures Association. Conning Investment Products, Inc. is also registered with the Ontario Securities Commission. Conning Asset Management Limited is Authorised and regulated by the United Kingdom's Financial Conduct Authority (FCA#189316); Conning Asia Pacific Limited is regulated by Hong Kong’s Securities and Futures Commission for Types 1, 4 and 9 regulated activities; Global Evolution Asset Management A/S is regulated by Finanstilsynet (the Danish FSA) (FSA #8193); Global Evolution Asset Management A/S (London Branch) is regulated by the United Kingdom's Financial Conduct Authority (FCA# 954331); Global Evolution Asset Management A/S, Luxembourg branch, registered with the Luxembourg Company Register as the Luxembourg branch(es) of Global Evolution Asset Management A/S under the reference B287058. It is also registered with the CSSF under the license number S00009438.. Conning primarily provides asset management services for third-party assets.
This publication is for informational purposes and is not intended as an offer to purchase any security. Nothing contained in this communication constitutes or forms part of any offer to sell or buy an investment, or any solicitation of such an offer in any jurisdiction in which such offer or solicitation would be unlawful.
All investments entail risk, and you could lose all or a substantial amount of your investment. Past performance is not indicative of future results which may differ materially from past performance. The strategies presented herein invest in foreign securities which involve volatility and political, economic and currency risks and differences in accounting methods. These risks are greater for investments in emerging and frontier markets. Derivatives may involve certain costs and risks such as liquidity, interest rate, market, and credit.
While reasonable care has been taken to ensure that the information herein is factually correct, Global Evolution makes no representation or guarantee as to its accuracy or completeness. The information herein is subject to change without notice. Certain information contained herein has been provided by third party sources which are believed to be reliable, but accuracy and completeness cannot be guaranteed. Global Evolution does not guarantee the accuracy of information obtained from third party/other sources.
The information herein is not intended to provide, and should not be relied upon for, accounting, legal or tax advice or investment recommendations.
Legal Disclaimer ©2025 Global Evolution.
This document is copyrighted with all rights reserved. No part of this document may be distributed, reproduced, transcribed, transmitted, stored in an electronic retrieval system, or translated into any language in any form by any means without the prior written permission of Global Evolution, as applicable.
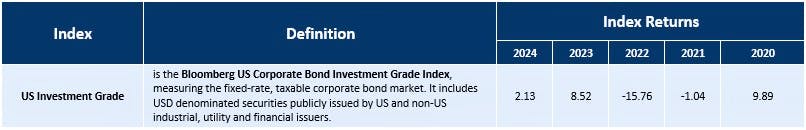
Appendix 1 – Mentioned Indices – Definition and Performance
Copyright © 2026 Global Evolution - All rights reserved