Dear visitor
You tried to access but this page is only available for
You tried to access but this page is only available for


Alexander Friis Illum
Senior Analyst
Ambitious goals supported by demographics
India's Prime Minister Narendra Modi has made it a public goal that India achieves highincome status by 2047, marking the 100-year anniversary of its independence. The threshold for a high-income country is a Gross National Income (GNI) per capita of USD 14,005 in 2023, while India's was USD 2,540, placing it in the lower middle-income group. To reach its 2047 goal, India needs to raise its GNI per capita by 5.5x over the next 23 years or equivalently to grow GDP by 8% annually (applying UN forecasts for population growth).
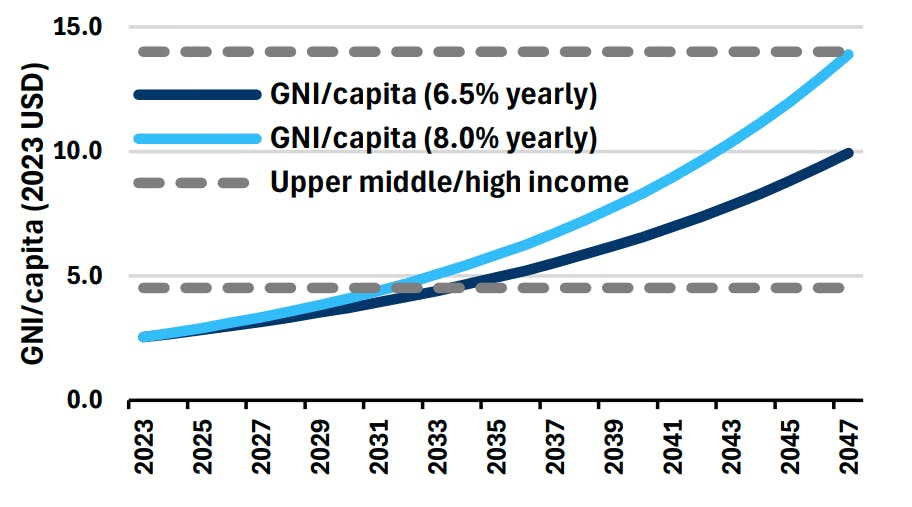
Clearly, 8% yearly growth over a 23-year period is ambitious and it might also prove to be overly ambitious. However, a few factors speak in favor of India achieving extraordinary growth rates in the coming decades. Most notably, India’s demographics are very supportive of continued growth, contrary to most other major economies in the World. In chart 2 below, we compare age dependency ratios (the amount of people aged 0-14 and 65+ compared to the amount of people aged 15-64) for the 5 largest economies Worldwide as forecasted by the UN for the next 23 years.
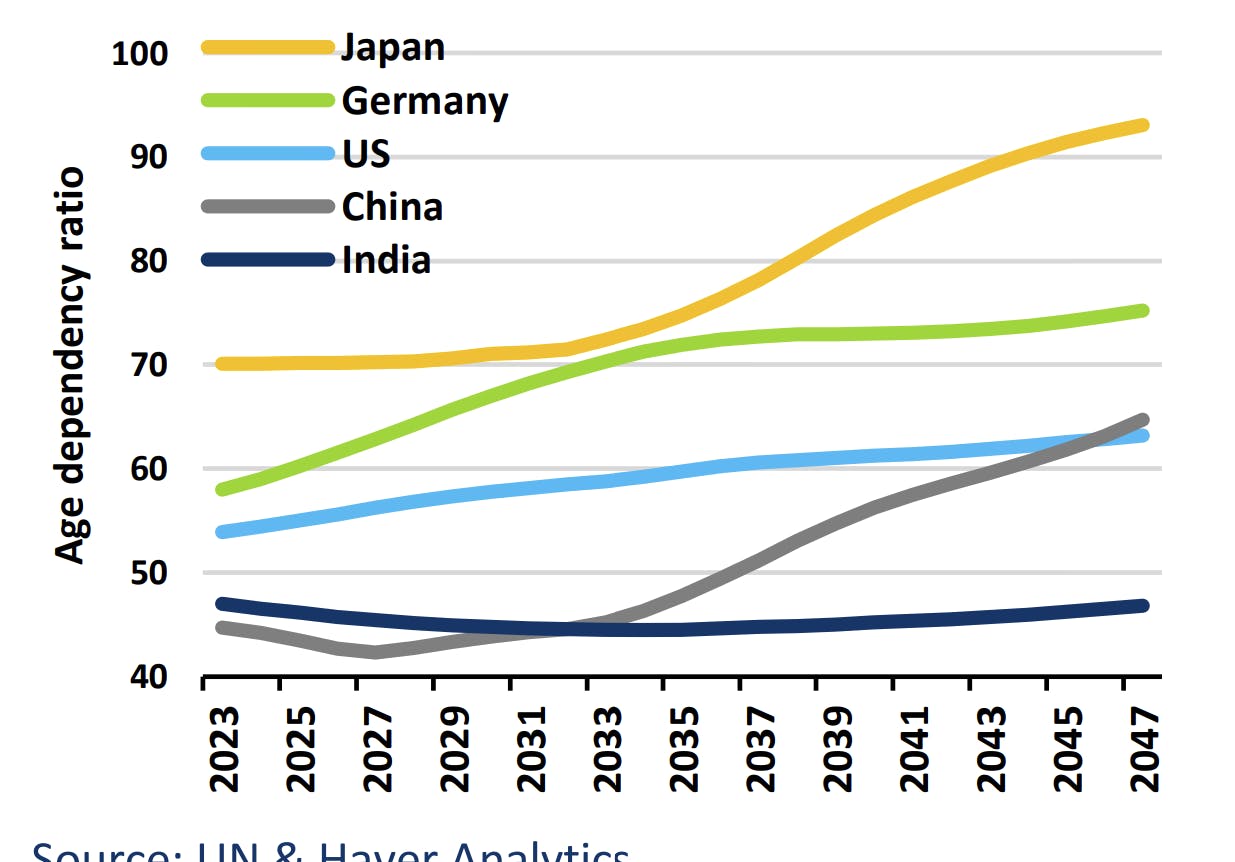
It is obvious from the chart that India stands in a unique demographic situation, where the age dependency ratio is going to decline slightly for the next 15 years before stabilizing. There will be more than two working-age adults for every single child or elderly in India through the next 23 years.
The age dependency ratio in China will weaken very abruptly from 2030 or so – and so will it in Germany and the US. Japan’s demographics are even more problematic. In Chart 3 below, we show that over time, there is a clear correlation between the age dependency ratio and GDP growth. Each dot in the chart represents a country (86 countries, representing a total of 98% of global GDP). On the X-axis we show the change in age dependency between years 2000 and 2019. On the Y-axis we show the average growth level from 2010-2019. We intentionally leave out the covid-affected years to get a closer view of effects on “potential” GDP growth.
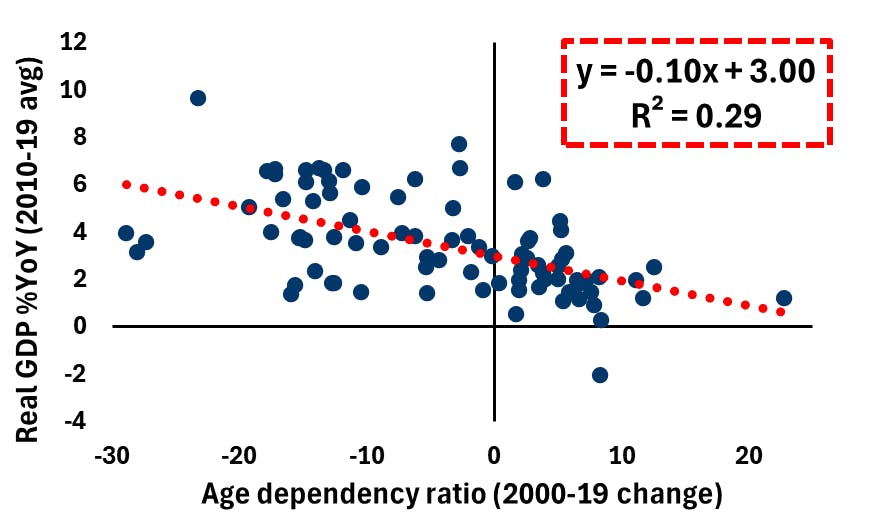
A higher age dependency ratio will in general mean that fewer people are available to work and generate economic output. Also, families need to allocate more resources to child-and elderly care (or pay higher taxes) rather than save and invest income for future productive capacity. If fiscal deficits rise to counter the rising age dependency ratios, it will generate higher debt burdens that can constrain GDP growth over time. These factors, we believe, are the main explanation for the correlation shown in Chart 3, which are supportive of growth in India.
8% annual growth: Challenging but possible
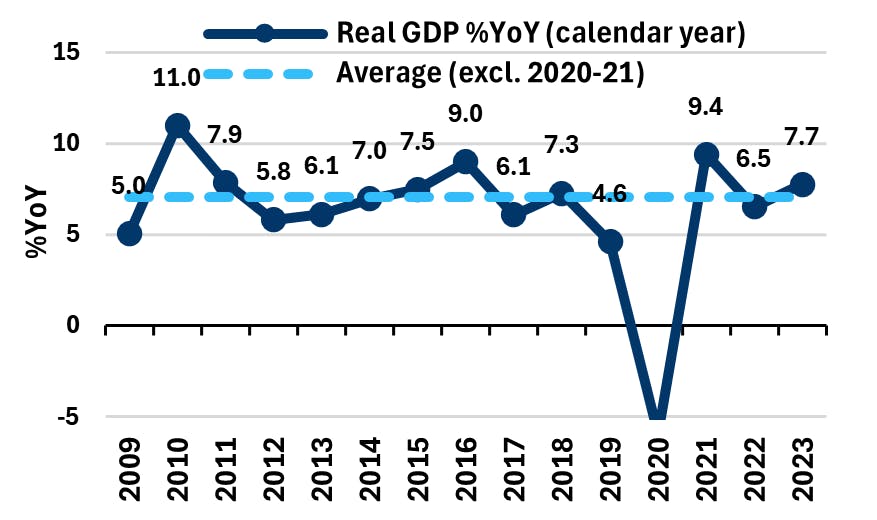
So, what speaks in favor of them reaching such a high level of growth? For one thing, they have been rather close in recent years. From 2010-2023 (excluding covid-affected 2020 and 2021), the average yearly growth rate was 7.2% (see chart 4), not that far away from 8%.
A factor with potential to bridge the gap to 8% is the high share of employment in agriculture. As chart 5 below depicts, 42.9% of the Indian workforce was employed in agriculture in 2023.
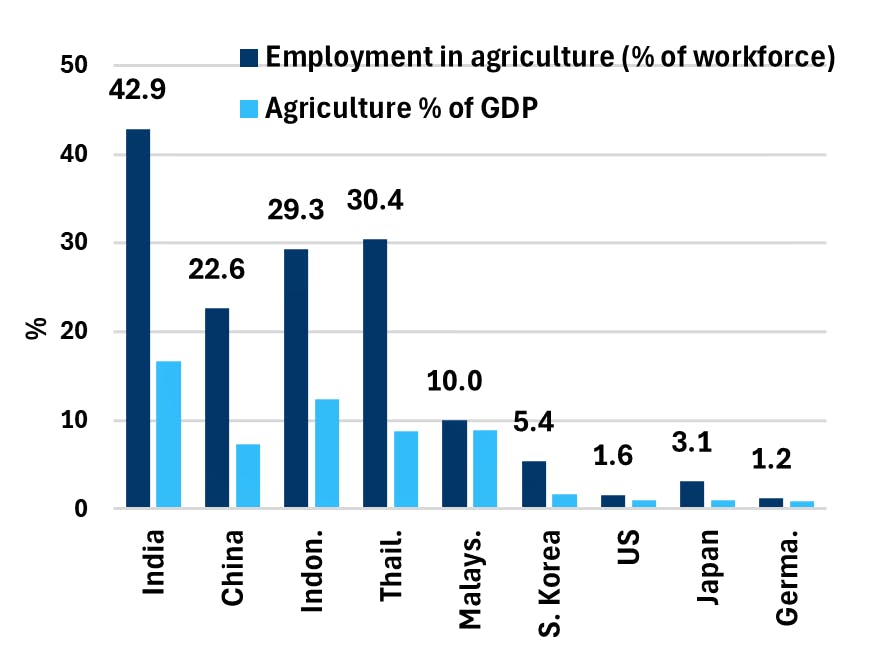
Furthermore, the 42.9% working in agriculture generated a meagre 16.6% of economic output, meaning that the remaining 57.1% of the workforce generated 83.4% of output. India’s growth potential could be highly improved, if they are able to rearrange the workforce towards manufacturing and services. China has done so, and so has Indonesia, Thailand and Malaysia through the last 20-40 years, while South Korea did it even earlier. These other Asian nations have achieved upper-middle- or high-income status. Another factor that speaks in favor of India’s rising income level and growth rates in the longer horizon is education levels.
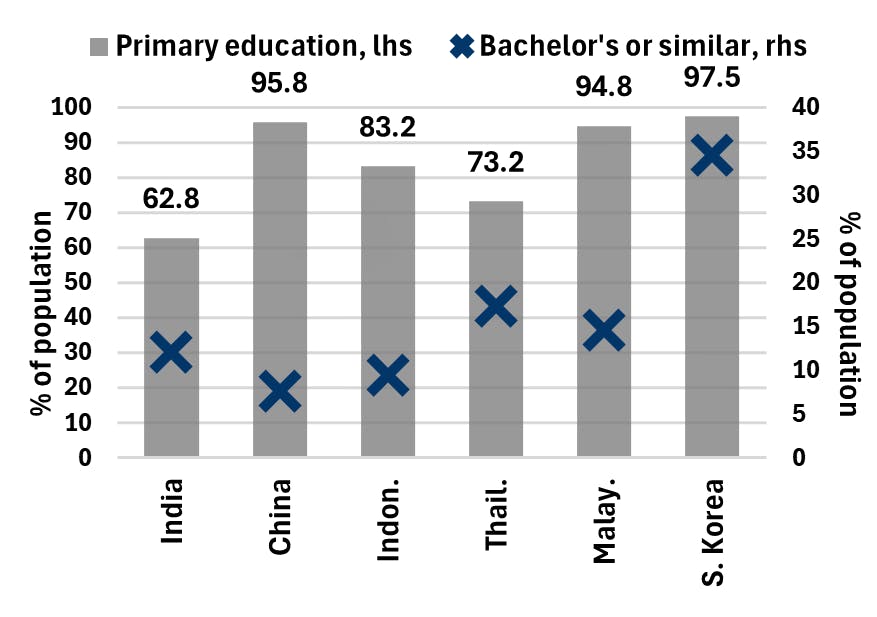
As India urbanizes and shifts from agriculture to services and manufacturing, primary and higher education rates will rise, boosting the country’s long-term growth and differentiating it from other Asian nations.
However, India faces structural challenges in moving up the value chain, such as bureaucratic land acquisition and rigid labor laws. To reach the extraordinary growth rates required to achieve high-income status by 2047, meaningful reforms are needed, but Modi may lack both willingness and mandate.
India as a global super-power
In the following charts, we provide a simplified outlook for how the World could look by 2047, if India is able to reach 8% yearly growth.
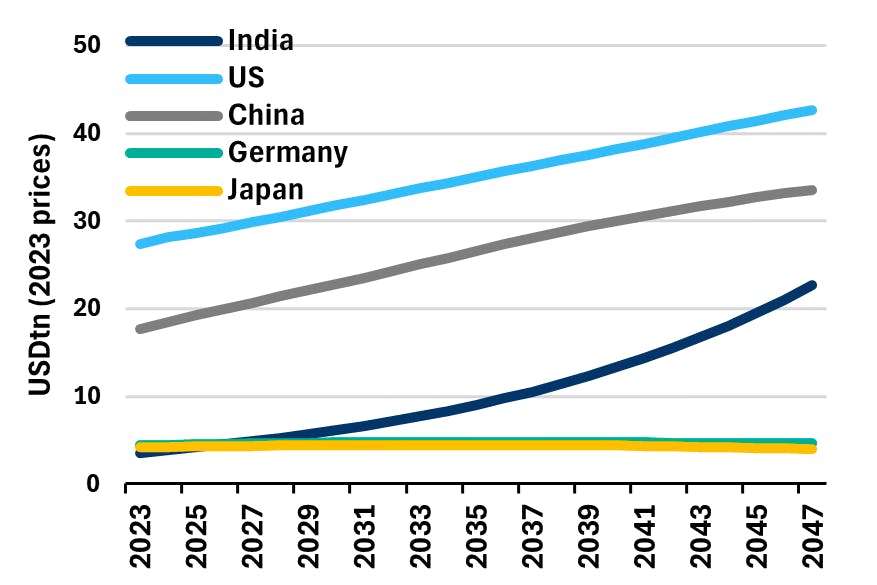
Until 2029, we use the IMF World Economic Outlook (WEO) forecasts for growth (except for India, where we use 8%). After that, we rely on changes in demographics, where we take the findings from Chart 2 above at face value. Hence, any 1-point rise in the age dependency ratio shaves 0.1%-pts off GDP growth. This is of course highly simplified, but the country-by-country differences of technology adoption and any associated productivity gains are difficult to forecast.
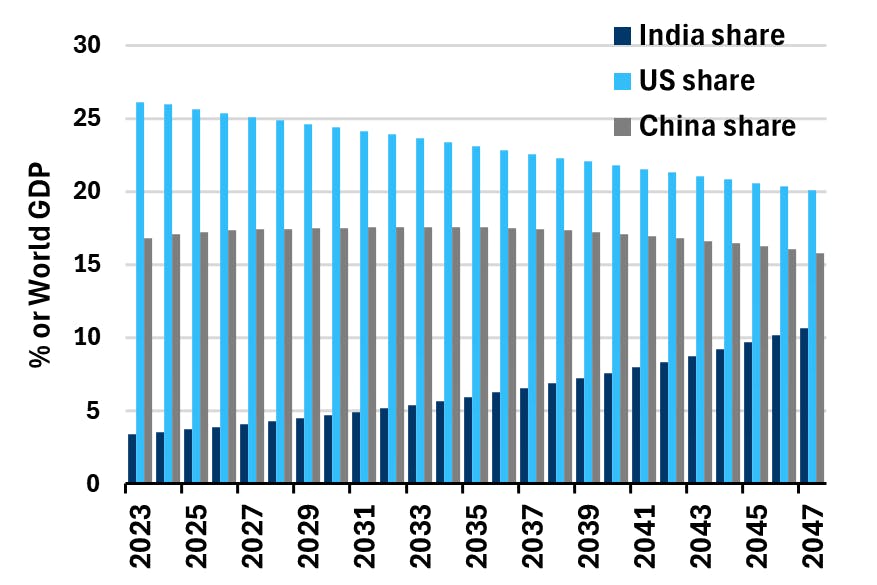
Charts 7 and 8 show the potential disruptions among global superpowers in the coming decades. While India will not "catch" China or the US, the gap will narrow. The Indian economy could grow 6x, with its share of global GDP rising from 3.4% today to 11%.
As India's economic importance grows, so will its role in financial markets. Unlike China, India’s equity markets are more open to foreign investors and less dominated by SOEs. The market capitalization of Indian equities relative to GDP has increased from 75% in 2015-19 to 120% in 2022-24, while Chinese equities have declined. If this trend continues, India could have the second-largest equity market by 2047.
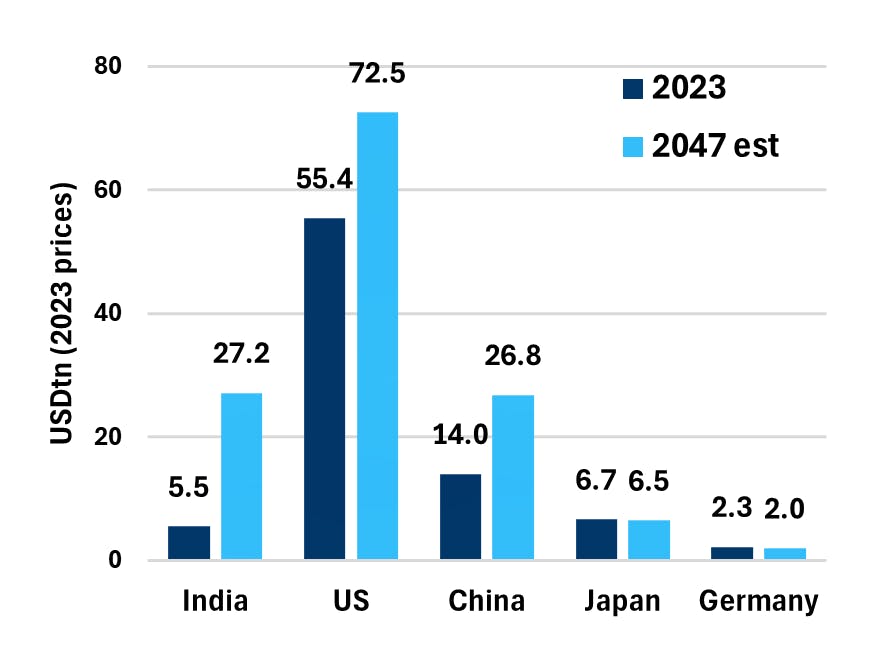
As it stands, the total amount of debt securities (bonds) issued by Indian entities is at 75% of GDP. This is lower than the 100% of GDP in Germany, 120% in China, 200% in the US and 285% in Japan. As the Indian economy grows, market access for the private sector becomes easier, and we would expect the total debt in the economy to grow relative to GDP. In Chart 10, we assume that India’s total debt-to-GDP rises to 120%, which is in line with China’s level today.
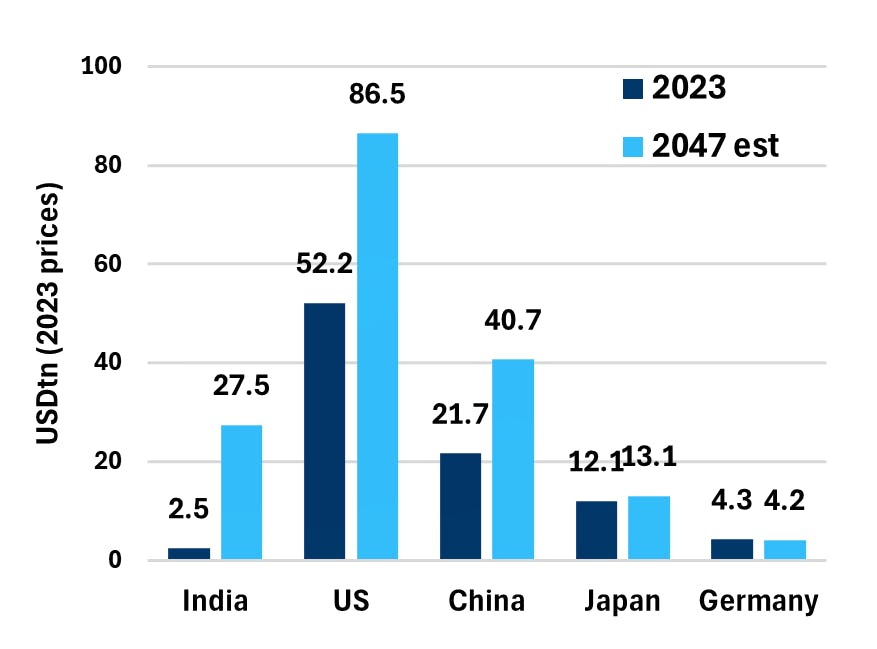
While India will still “only” be the third largest bond market, it will be 10x bigger than today. Capital movements into and out of India will have market-moving implications much more than the case is today.
Market returns on the road to high-income
We naturally care what happens to our returns in the time between now and 2047. Within fixed income (and FX), the case for high returns in the coming years and decades is less clear than for equities, as there is no direct connection to growth.
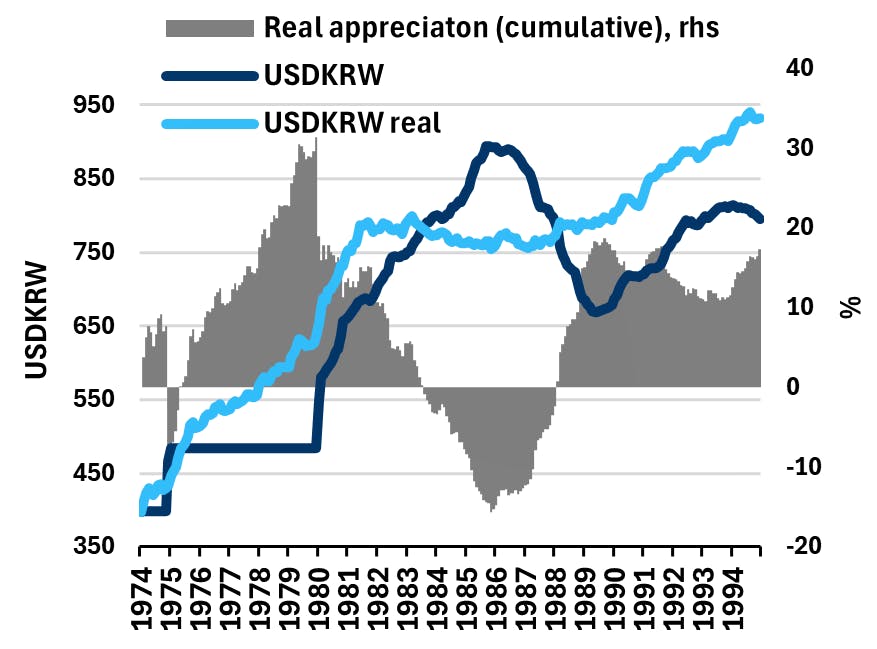
Back in 1974, South Korea had a GNI per capita of USD 550, which in 2023 prices translates to USD 2,600 or roughly where India is today. A little more than 20 years later, they became a high-income country with a GNI per capita above USD 18,000.
The dark blue line in Chart 11 above shows the development of the Korean Won (KRW) versus the US Dollar in nominal terms between 1974 and 1994. The light blue line shows how the development would have been if the FX pair only moved according to inflation differentials (‘law of one price’). As we see, the KRW was pegged in the 70s and weakened materially once made free-floating in 1980. But from that point onwards, KRW strengthened despite South Korea having higher inflation than the US, and the real appreciation of the period ended just shy of 20%
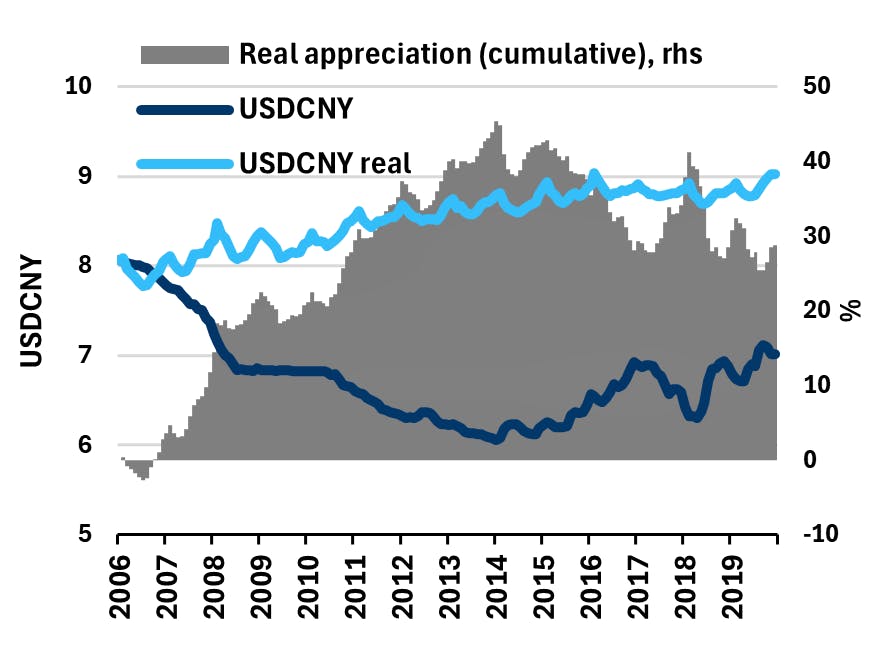
A similar – if even more straightforward – picture holds for the Chinese Yuan in the period where they moved from lower middleincome (like India today) to almost reaching high-income, as Chart 12 above shows. We could show similar charts for most other Asian countries that have made the journey from low- to high-income, but the trend is clear.
In the short-term, many things impact FX movements, and in the case of FX pairs as we show here, fluctuations are inevitable. However, in the long-term, as countries develop and move up the value chain, they attract investments, and their currencies strengthen more than warranted by the inflation differentials.
Despite government bond yields being highly impacted by the inflation environment and outlook, it seems that countries moving up the income ladder in general experience falling real yields (see e.g. Chart 13 below).
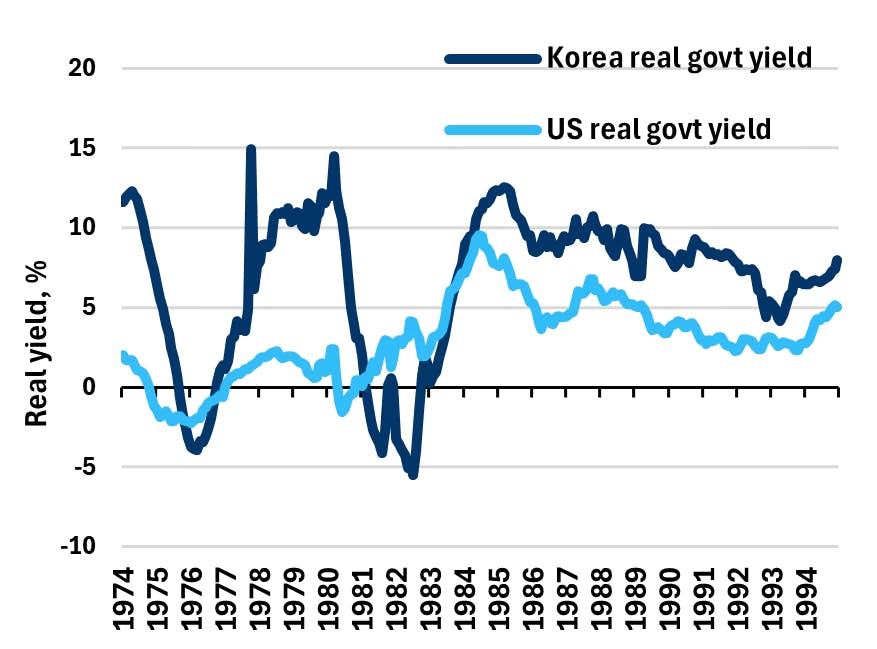
Data availability of bond yields is somewhat problematic back in time, but the IMF collects a weighted-average series. Once again using the example from Korea in 70s-90s, where we deduct the 2-year rolling average CPI inflation from the nominal yield (same method for the US), we see clear evidence of real yields dropping. The first 10 years were marked by high and volatile inflation, but from 1985, we see the real yield gradually falling and the spread to the US compressing.
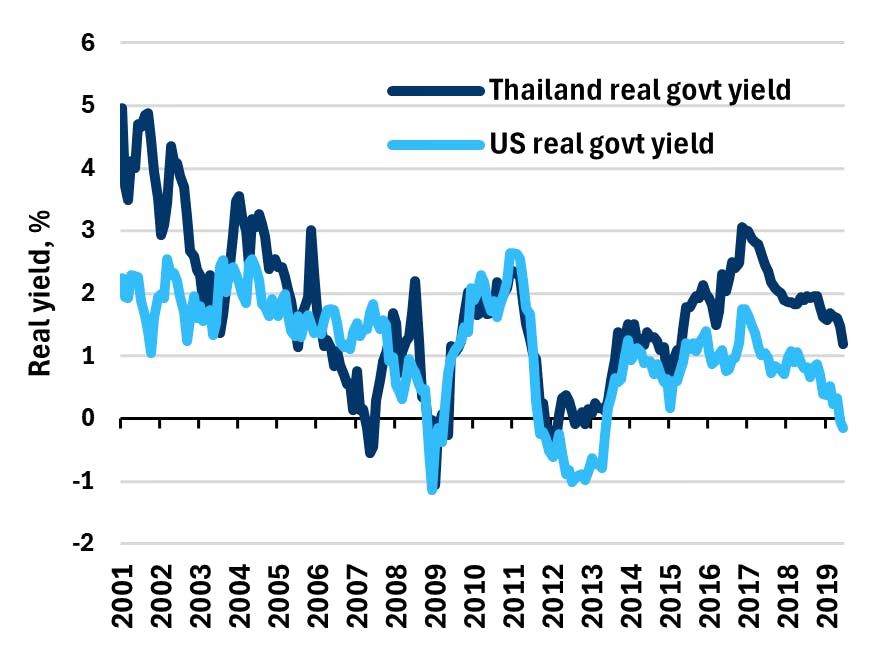
Thailand is not yet knocking the door to highincome, but their GNI per capita rose 2.5x between 2001 and 2019 and is currently 3x the size of India’s. In this period, we saw a drop in real yields and stabilization versus the US.
We are acutely aware that short-term market movements are influenced by a range of factors beyond improvements in per-capita income. Still, other Asian countries that have undergone this journey in the past 50 years have experienced the positive developments we are seeking. While we don't typically invest in inflation-adjusted FX or real rates (though in some cases we do), countries with strong potential in real FX or real rates often show similar potential in nominal terms.
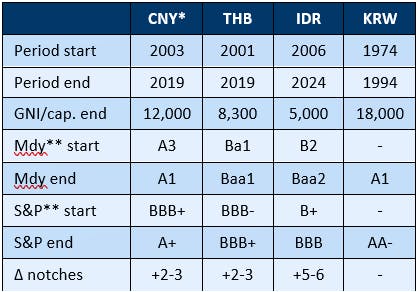
The Indian government has so far refrained from issuing a sovereign Eurobond yet holds a Baa3 rating from Moody’s and a BBB- rating from S&P. Table 1 shows rating developments from when countries had a GNI per capita similar to India’s today. While the end levels vary, all of them are at least twice as high as India’s current level. During this period, these countries clearly experienced numerous rating upgrades. For Korea, ratings are not available as far back as the 1970s, but it is reasonable to assume that they would not have had an A1 or AA- rating at that time. Other factors besides growth are at play, but the trend is clear.
If India were upgraded by three notches in the coming years, spreads could compress by around 50 basis points, based on current JP Morgan EMBI prices—an attractive opportunity for investors.
Conclusion
Prime Minister Modi’s goal for India to attain high-income status by 2047 is undeniably ambitious. However, several factors suggest that India could achieve remarkable growth and substantial increases in per capita income in the coming decades. The most obvious factor is India's favorable demographics, which stand in stark contrast to its global peers. Additionally, a relatively low share of the population has basic education, and a high proportion is employed in agriculture. As the country develops, more people will gain access to better education and higher-paying jobs.
If this outlook materializes, India could emerge as an economic superpower. Its share of global GDP could approach China’s, while its financial markets would become a focal point for global investors. A study of other Asian countries that transitioned to high-income status over the past 50 years provides clear evidence that this journey has offered investors attractive returns in fixed income and FX markets. In our view, India may very well follow a similar path.
Disclaimer & Important Disclosures
Global Evolution Asset Management A/S (“Global Evolution DK”) is incorporated in Denmark and authorized and regulated by the Finanstilsynets of Denmark (the “Danish FSA”). Global Evolution DK is located at Buen 11, 2nd Floor, Kolding 6000, Denmark.
Global Evolution DK has a United Kingdom branch (“Global Evolution Asset Management A/S (London Branch)”) located at Level 8, 24 Monument Street, London, EC3R 8AJ, United Kingdom. This branch is authorized and regulated by the Financial Conduct Authority under the Firm Reference Number 954331.
In the United States, investment advisory services are offered through Global Evolution USA, LLC (‘Global Evolution USA”), an SEC registered investment advisor. Registration with the SEC does not infer any specific qualifications Global Evolution USA is located at: 250 Park Avenue, 15th floor, New York, NY. Global Evolution USA is an wholly-owned subsidiary of Global Evolution Asset Management A/S (“Global Evolution DK”). Global Evolution DK is exempt from SEC registration as a “participating affiliate” of Global Evolution USA as that term is used in relief granted by the staff of the SEC allowing U.S. registered investment advisers to use investment advisory resources of non-U.S. investment adviser affiliates subject to the regulatory supervision of the U.S. registered investment adviser. Registration with the SEC does not imply any level of skill or expertise. Prior to making any investment, an investor should read all disclosure and other documents associated with such investment including Global Evolution’s Form ADV which can be found at https://adviserinfo.sec.gov.
In Singapore, Global Evolution Fund Management Singapore Pte. Ltd has a Capital Markets Services license issued by the Monetary Authority of Singapore for fund management activities. It is located at Level 39, Marina Bay Financial Centre Tower 2, 10 Marina Boulevard, Singapore 018983.
Global Evolution is affiliated with Conning, Inc., Goodwin Capital Advisers, Inc., Conning Investment Products, Inc., a FINRA-registered broker dealer, Conning Asset Management Limited, Conning Asia Pacific Limited and Octagon Credit Investors, LLC are all direct or indirect subsidiaries of Conning Holdings Limited (collectively, “Conning”) which is one of the family of companies owned by Cathay Financial Holding Co., Ltd., a Taiwan-based company. Conning has offices in Boston, Cologne, Hartford, Hong Kong, London, New York, and Tokyo.
Conning, Inc., Conning Investment Products, Inc., Goodwin Capital Advisers, Inc., Octagon Credit Investors, LLC, are registered with the Securities and Exchange Commission (“SEC”) under the Investment Advisers Act of 1940 and have noticed other jurisdictions they are conducting securities advisory business when required by law. In any other jurisdictions where they have not provided notice and are not exempt or excluded from those laws, they cannot transact business as an investment adviser and may not be able to respond to individual inquiries if the response could potentially lead to a transaction in securities. Conning, Inc. is also registered with the National Futures Association and Korea’s Financial Services Commission. Conning Investment Products, Inc. is also registered with the Ontario Securities Commission. Conning Asset Management Limited is authorised and regulated by the United Kingdom's Financial Conduct Authority (FCA#189316), Conning Asia Pacific Limited is regulated by Hong Kong’s Securities and Futures Commission for Types 1, 4 and 9 regulated activities
This publication is for informational purposes and is not intended as an offer to purchase any security. Nothing contained in this website constitutes or forms part of any offer to sell or buy an investment, or any solicitation of such an offer in any jurisdiction in which such offer or solicitation would be unlawful.
All investments entail risk and you could lose all or a substantial amount of your investment. Past performance is not indicative of future results which may differ materially from past performance. The strategies presented herein invest in foreign securities which involve volatility and political, economic and currency risks and differences in accounting methods. These risks are greater for investments in emerging and frontier markets. Derivatives may involve certain costs and risks such as liquidity, interest rate, market and credit.
This communication may contain Index data from J.P. Morgan or data derived from such Index data. Index data information has been obtained from sources believed to be reliable but J.P. Morgan does not warrant its completeness or accuracy. The Index is used with permission. The Index may not be copied, used, or distributed without J.P. Morgan's prior written approval. Copyright 2024, J.P. Morgan Chase & Co. All rights reserved.
While reasonable care has been taken to ensure that the information herein is factually correct, Global Evolution makes no representation or guarantee as to its accuracy or completeness. The information herein is subject to change without notice. Certain information contained herein has been provided by third party sources which are believed to be reliable, but accuracy and completeness cannot be guaranteed. Global Evolution does not guarantee the accuracy of information obtained from third party/other sources.
The information herein is not intended to provide, and should not be relied upon for, accounting, legal or tax advice or investment recommendations. This document does not constitute investment advice. The contents of this document represent Global Evolution's general views on certain matters, and is not based upon, and does not consider, the specific circumstance of any investor.
Legal Disclaimer ©2024 Global Evolution.
This document is copyrighted with all rights reserved. No part of this document may be distributed, reproduced, transcribed, transmitted, stored in an electronic retrieval system, or translated into any language in any form by any means without the prior written permission of Global Evolution, as applicable.
Copyright © 2025 Global Evolution - All rights reserved
