Dear visitor
You tried to access but this page is only available for
You tried to access but this page is only available for


Michael Wainø Hansen
Senior Strategist
2024 – A Turbulent Year Is Over
What a year it has been. The election calendar was among the busiest on record, delivering market-moving results in major emerging economies like Mexico, South Africa, and India. Meanwhile, the BRIC coalition originally encompassing Brazil, Russia, India, and China, and later joined by South Africa underwent a dramatic expansion. Countries such as Egypt, Ethiopia, Iran, and the UAE joined its ranks, forming a diverse alliance united primarily by a desire to distance themselves from U.S. dominance. Additionally, a long queue of nations, including Turkey, Indonesia, Nigeria, and Vietnam, expressed interest in joining as "partner states."
In Europe, political turmoil defined the year. In France, Marine Le Pen's far-right National Rally party secured 31.5% of the vote in EU parliamentary elections, prompting President Macron to call domestic snap elections. The outcome was a hung parliament headed by Michel Barnier, the former EU Brexit negotiator. However, his government lasted only three months before being toppled by a no-confidence vote on December 4 and leaving French politics in the doldrums until new elections can be called in Jul 25.
In Germany, Chancellor Olaf Scholz's "traffic light" coalition fell apart as the FDP withdrew over disputes about loosening the so-called "Schuldenbremse" (debt brake). Facing gridlock, Scholz called for snap elections, scheduled for 23 Feb 25.
Across the Atlantic, the 2024 U.S. presidential campaign was nothing short of historic. During the race, former President Donald Trump survived an assassination attempt, while President Joe Biden faced mounting criticism after a disastrous performance in a televised debate against Trump. Under pressure from influential Democratic leaders, Biden ultimately withdrew from the race, paving the way for Vice President Kamala Harris to become the Democratic Party’s presidential nominee.
In a dramatic turn of events, Donald Trump made history as only the second U.S. president ever to reclaim the White House after a previous defeat. Unlike his narrow 2016 victory, Trump’s 2024 comeback was resounding winning not only the Electoral College but also the popular vote by a decisive margin of 3.2mn, bolstering the legitimacy of his mandate.
On the economic front, the United States defied all gloomy forecasts including ours. U.S. exceptionalism was on full display as growth remained robust, and U.S. stock indices hit one all-time high after another.
Nevertheless, as inflationary pressures eased in the U.S. and the Eurozone, the central banks of those countries pivoted sharply from hawkish to dovish stances, slashing interest rates, while the Bank of Japan went in the opposite direction. Investors oscillated between hard-landing, soft-landing, and no-landing narratives.
In China, the People’s Bank of China ramped up monetary stimulus in response to sluggish growth as the central government acted to ease the mounting local government debt burden. Efforts to address the real estate bubble offered no quick solutions, though, and fiscal support targeting households and consumer sentiment is yet to be seen.
In broader emerging markets, monetary easing dominated, except in Brazil, where fiscal concerns and a record-low Brazilian real (BRL) prompted rate hikes.
Geopolitics remained fraught. The war in Ukraine passed the grim milestone of 1,000 days, while tensions in the Middle East escalated. What began as an Israel-Hamas conflict widened to involve Hezbollah, Lebanon, and Iran.
Finally, still in the Middle East, the Syrian regime under Bashar Hafez al-Assad unexpectedly collapsed like a house of cards after 13 years of civil war, as neither Russia nor Iran proved capable of holding back a rapidly advancing Hayat Tahrir al-Sham (HTS) militia. This sets the stage for an uncertain future in Syria and a new power struggle in the Middle East.
As 2024 draws to a close, uncertainty loomed over global politics and economics, setting the stage for a potentially equally turbulent 2025.
Countdown to Trump 2.0
Having learned from his 2016 experience, Trump now appears far better prepared and poised to take decisive action from his first day in office.
This time, Donald Trump has assembled a team of individuals who are both deeply loyal to him and aligned with his restrictive views on issues ranging from international institutions like NATO, WTO, and IMF to taxes, regulation, immigration, trade, and geopolitics. In contrast, while Trump’s views in 2016 were similar, his team then was a compromise between MAGA loyalists and traditional GOP members, including figures like former Vice President Mike Pence.
The outlines of the Trump administration’s next four years are becoming clearer. As Trump puts it, "tariff" is the "most beautiful word," and USMCA partners Mexico and Canada have already experienced his willingness to use tariffs as leverage for reasons beyond trade practices. As things stand, U.S. trade policy is expected to shift toward greater protectionism, potentially leading to further disruptions in global supply chains, with China and the EU at the forefront of tensions.
Fiscal policy will be overhauled, with tax cuts taking center stage. Whether increased economic activity, market optimism ("animal spirits"), spending cuts and tariff revenues can offset the resulting budgetary impacts remains to be seen.
Immigration policy is expected to become more restrictive, reducing the supply of foreign labor and potentially driving higher wage inflation as a result.
We will delve deeper into the topics above later in this text.
Trump, the Peacemaker
In foreign policy and geopolitics, American support for traditional allies will likely continue, but with added conditions: allies will be expected to contribute more to their own security including contribute more to NATO. The wars in Ukraine and the Middle East, as well as tensions between China and Taiwan, are increasingly framed as shared global responsibilities rather than solely America’s burden.
A Mandate to Fight Inflation, Not to Fuel it
While many economists have warned of the negative economic consequences of Trump’s policies, it may be premature to predict disaster. Tariffs, while inflationary, conflict with the mandate Trump received from voters frustrated by high inflation during the Biden administration. For this reason, a balanced approach is more likely: intermediate goods could face higher tariffs, while consumer goods may see relatively lower tariffs, with the average tariff on U.S. imports from China expected to remain well below 60%.
Why Large-Scale Tariffs Are Unlikely
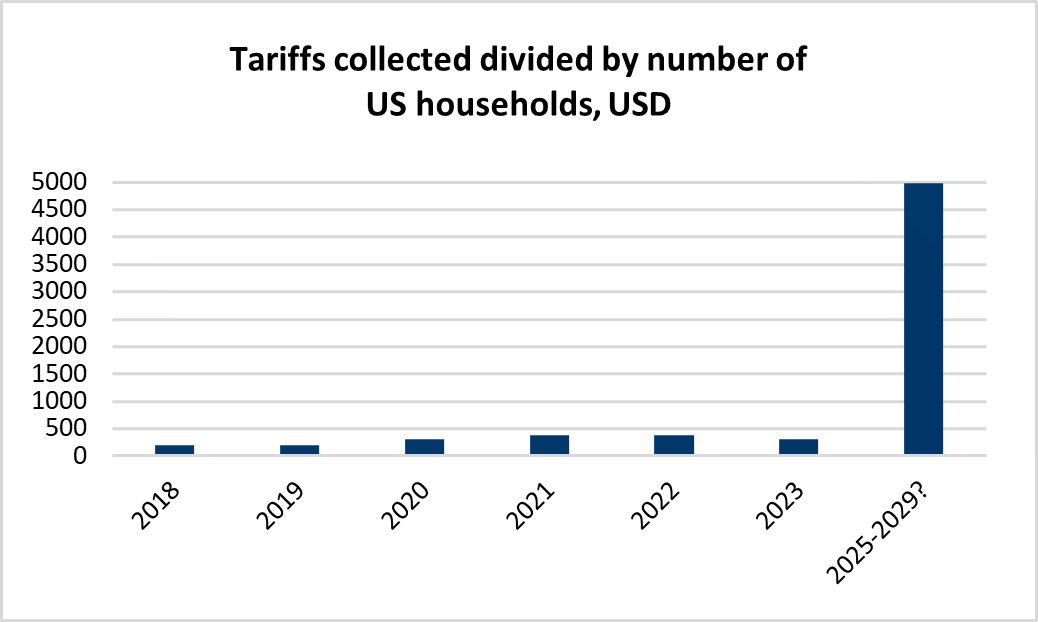
In 2023, the United States imported goods totaling approximately USD3.1tr, with USD427bn coming from China. In a worst-case scenario, imposing a 60% tariff on Chinese imports and up to 20% on goods from other countries could generate an estimated USD523bn to USD790bn in tariff revenues, effectively acting as tax increases.
If the full cost of these tariffs were passed on to consumers without any changes in behavior, it would mean an additional financial burden of USD1,500 to USD2,400 per person or USD3,980 to USD6,000 per household annually[1] which is exactly why tariffs on the scale proposed are unlikely to be implemented because they would contradict the mandate given to Donald Trump by voters.
What We Are Focused on in 2025
Trump's selection of hedge fund manager Scott Bessent as Treasury Secretary has been positively received by the market. Unlike Trump’s prominent campaign supporter Elon Musk, who has criticized fiscal "business as usual," the market appears to favor Bessent's more prudent conventional approach.
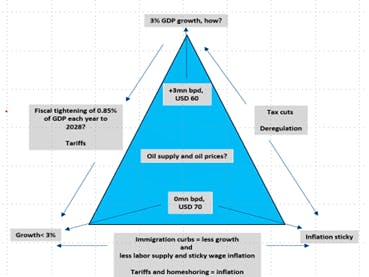
Bessent has introduced a "3-3-3" economic framework, targeting 3% GDP growth, a 3% fiscal deficit-to-GDP ratio, and an additional 3 million barrels of daily oil production. This ambitious plan attempts to balance competing priorities, but we question whether a 3% deficit target can align with 3% growth, Trump's proposed tax cuts, and the additional challenges posed by restrictions on immigration and labor supply.
Department of Government Efficiency (DOGE)
Speaking of Elon Musk. The creation of the Department for Government Efficiency, to be co-led by Elon Musk and Vivek Ramaswamy, introduces a significant wildcard. Musk asserts that he can reduce federal spending by approximately USD2tr through a restructuring of federal agencies, though the specifics and timeline for achieving such savings remain unclear. Former Treasury Secretary Larry Summers has expressed skepticism, stating that Musk would be fortunate to identify even USD200bn in budget cuts, given the limited scope for eliminating waste within the federal budget.
To illustrate some of the challenges Elon Musk faces: In FY24, the U.S. government spent USD6.75tr, exceeding its revenue and creating a deficit. Of this spending, 61% was mandatory, 26% was discretionary, and 13% went toward net interest payments.
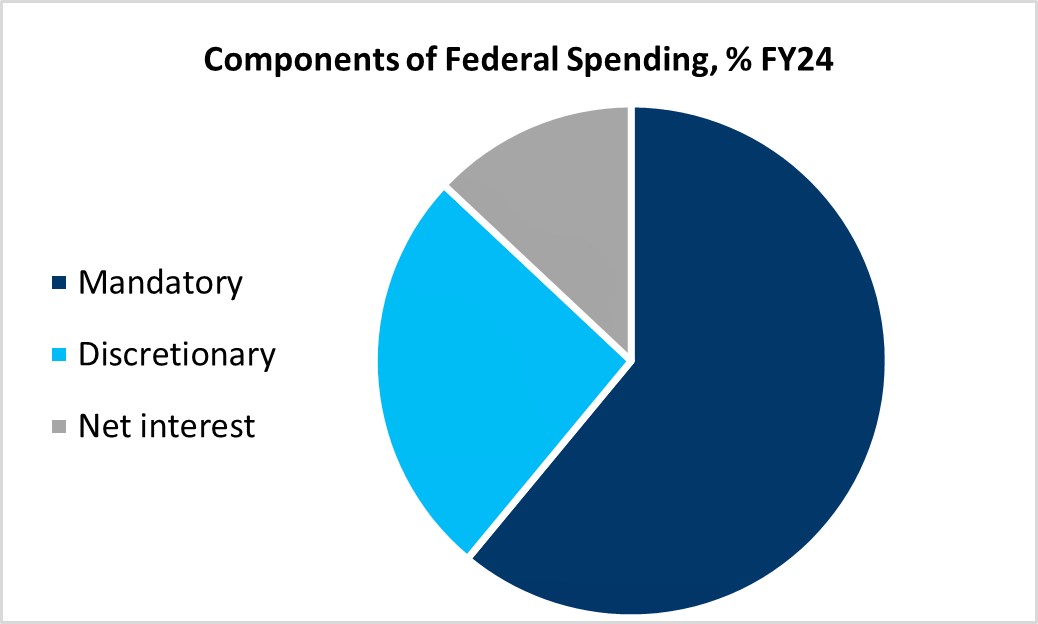
Changing mandatory programs requires amending the applicable authorizing law to modify eligibility, benefits (either up or down), or funding levels specified in the law.
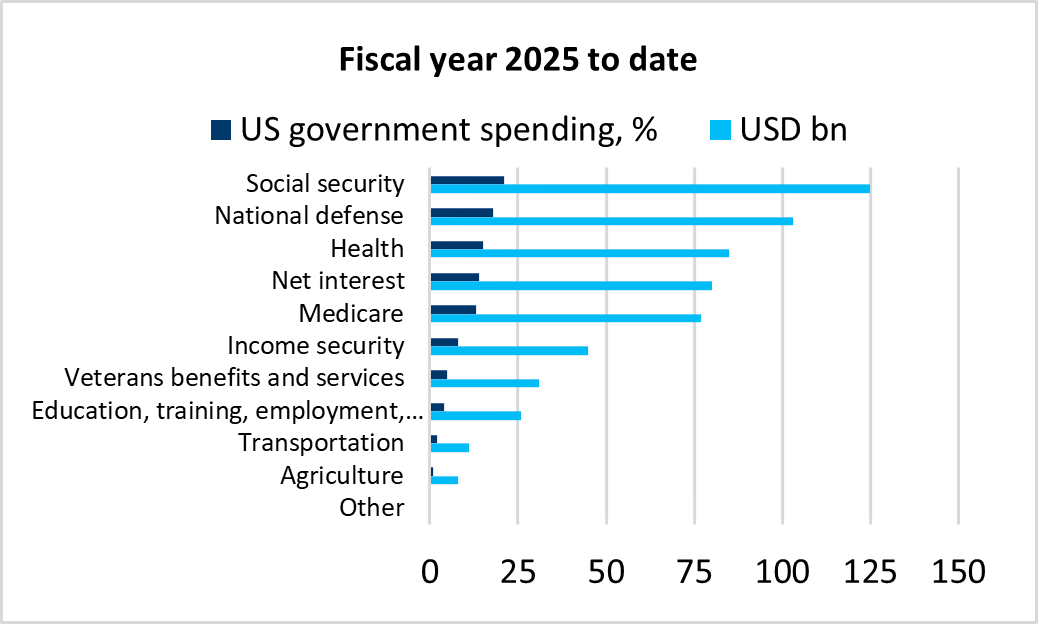
In contrast, for discretionary spending, the authorizing law that establishes a program, agency, or activity does not determine the funding level. Instead, funding is set through annual appropriations legislation. Most defense spending is handled this way, along with the operating budgets of civilian agencies, veterans' medical care, grant programs for education, medical and scientific research, and certain low-income assistance programs (such as housing) that do not necessarily serve everyone who is eligible.
Given that 61% of government spending is mandatory, which would likely require difficult congressional approval to reduce, Elon Musk is left with 26% in discretionary spending and 13% in net interest payments. Reducing net interest spending with a debt-to-GDP ratio of 123% is challenging, and default can likely be ruled out. The remaining 26% of the USD6.75tr, or USD1.76tr, is allocated to defense civilian agencies, veterans' medical care, grant programs, education, medical and scientific research, and low-income assistance programs.
Why Does it Matter?
If Scott Bessent and/or Elon Musk fail to reduce the federal deficit and growth remains strong due to tax cuts and deregulation, the Fed funds terminal rate and the term premium on longer-dated treasuries could end up being higher than what the market is currently pricing.
Nevertheless, we expect the U.S. Federal Reserve to continue easing monetary policy in 2025. This expectation is partly based on the assumption that growth will slow in the second half of 2025, as the initial wave of "animal spirits" subsides and the diminishing growth impulse from tariffs and reduced immigration to the U.S. becomes evident. Additionally, we align with Trump’s notion that lower energy prices will contribute to declining inflation.
From 2026 onward, growth may rebound as the initial impact of tariffs diminishes and is offset by the effects of tax cuts.
Drill, Baby Drill
The final "3" in Treasury Secretary Scott Bessent's "3-3-3" economic framework refers to an additional 3 million barrels per day in crude oil output. His boss, Donald Trump, views increased drilling for oil and natural gas as crucial to lowering energy prices and, by extension, overall inflation. However, Exxon Mobil Corp.'s upstream President, Liam Mallon, recently pushed back against the "drill baby, drill" mantra, arguing that a drastic change in output is unlikely because players in the oil and gas industry are primarily focused on the economics of their operations.
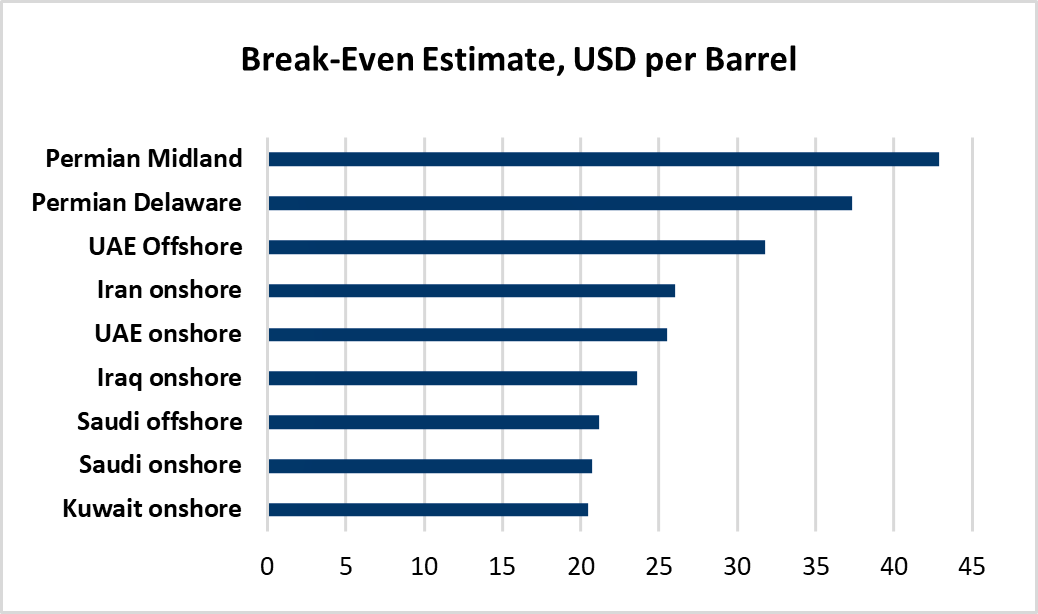
And maybe Trump should be cautious about what he wishes for, as many OPEC+ producers can withstand lower prices better than their U.S. counterparts.
Interestingly, during Trump’s first Presidency, higher import tariffs - albeit at a lower scale than what is now proposed - were hardly visible in headline CPI statistics where oil prices seemed the main driver.

OPEC+ to the Rescue
U.S. crude production has already hit a record high of 13.5mn barrels per day and an increase of 3mn barrels per day equivalent to 22% of current production looks overly ambitious.
Still, with the U.S. crude production at a record high, OPEC's global market share has diminished due to self-imposed production cuts designed to keep prices in the USD 70–80 per barrel range. Currently, OPEC holds 6.6mn barrels per day in spare capacity.
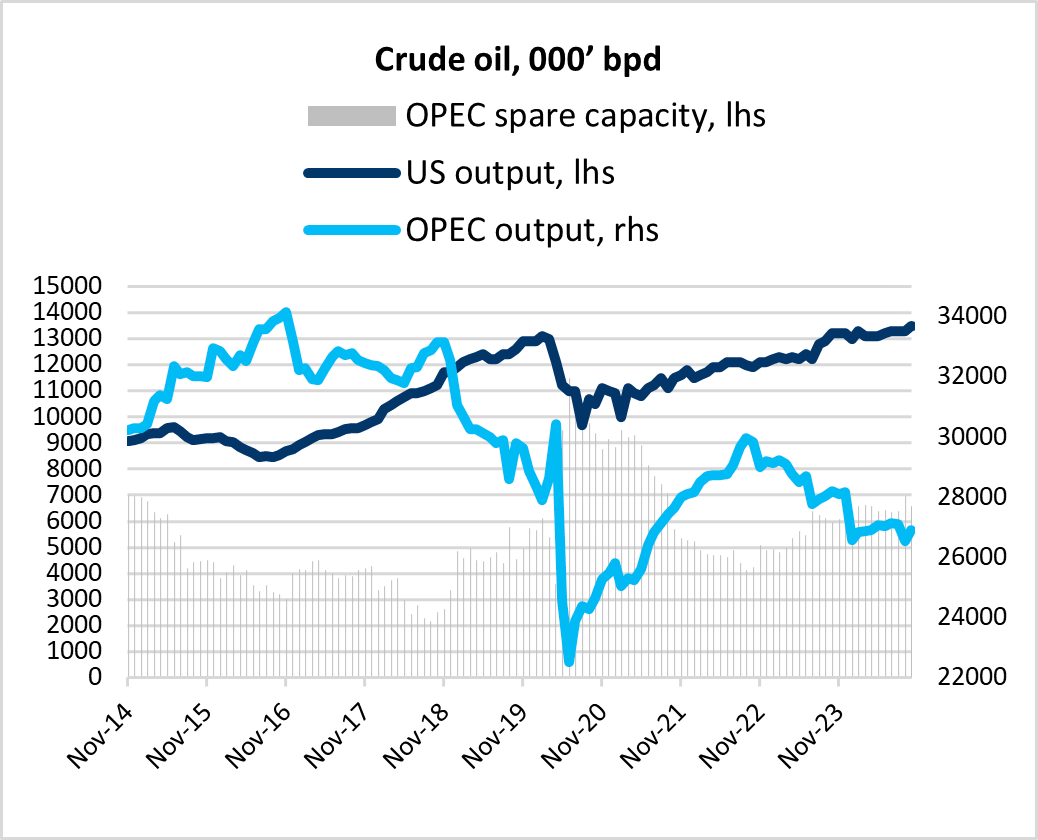
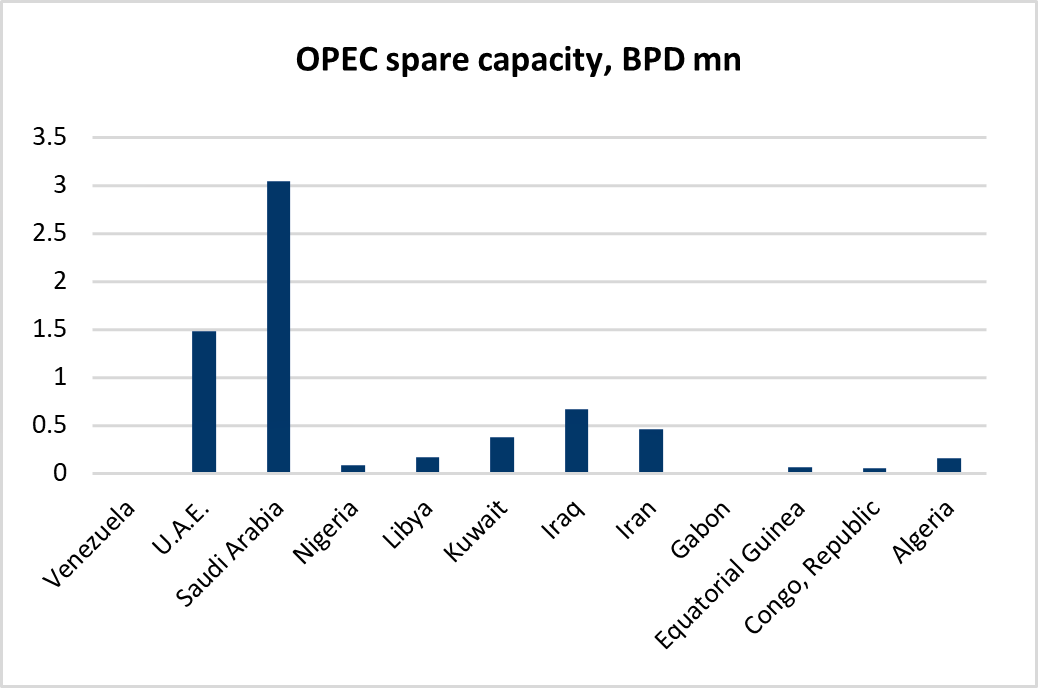
However, the current output policy led to Angola's departure from OPEC+ earlier in 2024, and Gabon, Equatorial Guinea, and the Republic of Congo are said to reconsider their membership.
On 5 Dec 24, OPEC+ agreed to extend the existing voluntary production cuts of 2.2 mn barrels per day through the end of Mar 25. Saudi Arabia is not yet willing to admit defeat and is reportedly pressuring OPEC members like Iraq and Kazakhstan to adhere to production limits, while disgruntled members argue that OPEC's price-supporting strategy has unintentionally boosted supply from outside the group. Riyad may be banking on Donald Trump, once in office, to restrict oil exports from Iran and Venezuela to help sustain prices. However, if Saudi Arabia eventually yields to pressure from discontented OPEC members, the market faces a glut.
In a tail-risk scenario, Saudi Arabia could attempt to regain global market share by flooding the market, as it did in 2020, potentially driving prices below the break-even point for U.S. shale. However, we believe Saudi Arabia will increase output while allowing prices to drop as low as USD 60 per barrel.
Trump and Emerging Markets
With Donald Trump’s return to The White House, the outlook for emerging markets (EM) and emerging economies reflects a mix of challenges and opportunities shaped by his administration's policies.
Starting with China, a key player in the global economy and the broader emerging markets landscape, the sovereign's 5% growth target already appeared ambitious before Donald Trump's re-election. Now, with Chinese exports to the U.S. expected to encounter tariff-related headwinds, achieving this target seems increasingly unlikely.
As we write, the People's Bank of China (PBoC) is leaning against CNY depreciation. However, if the Trump administration were to impose broad tariffs anywhere near the 60%, the PBoC would have no choice but to let the renminbi weaken. If so, we believe this will take place in an orderly manner and would not be surprised should the renminbi slide to at least 7.60 against the dollar.
One reason the tariffs imposed by the Trump administration on Chinese goods in 2018 had little impact on U.S. CPI inflation (see figure 9 below) is that the Chinese renminbi depreciated by over 12% against the dollar between Apr 18 and Aug 19, before sharply appreciating during the post-pandemic export-driven recovery.
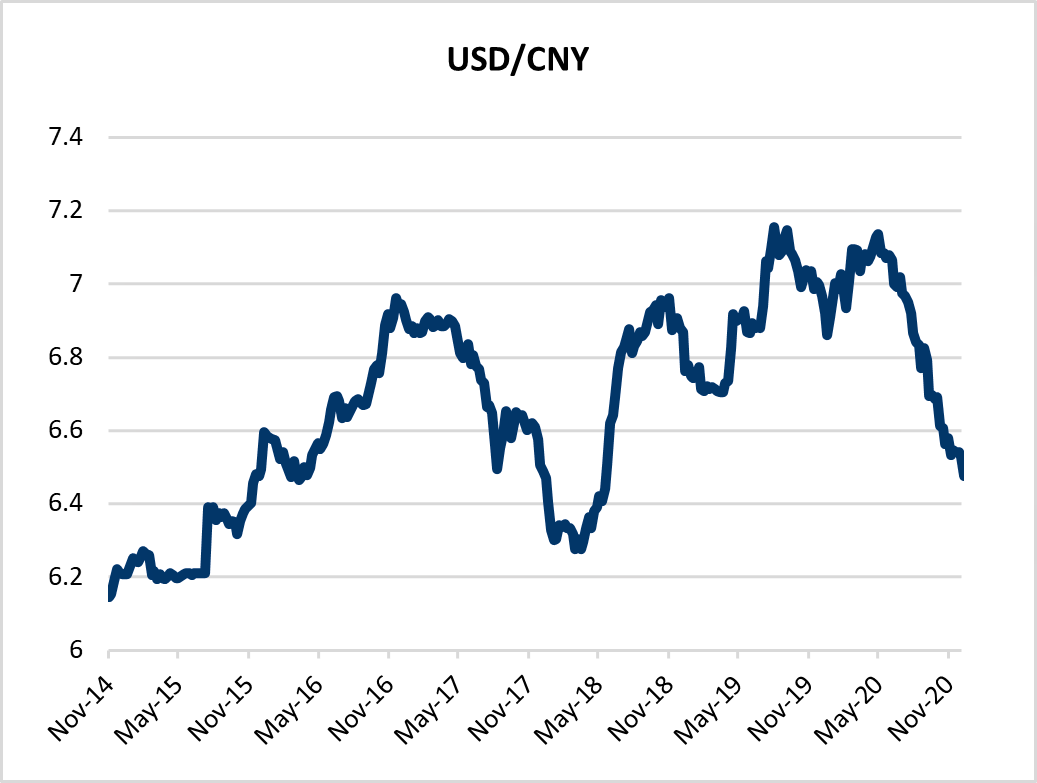
With deflationary pressures persisting, monetary support for the renminbi would be off the table.
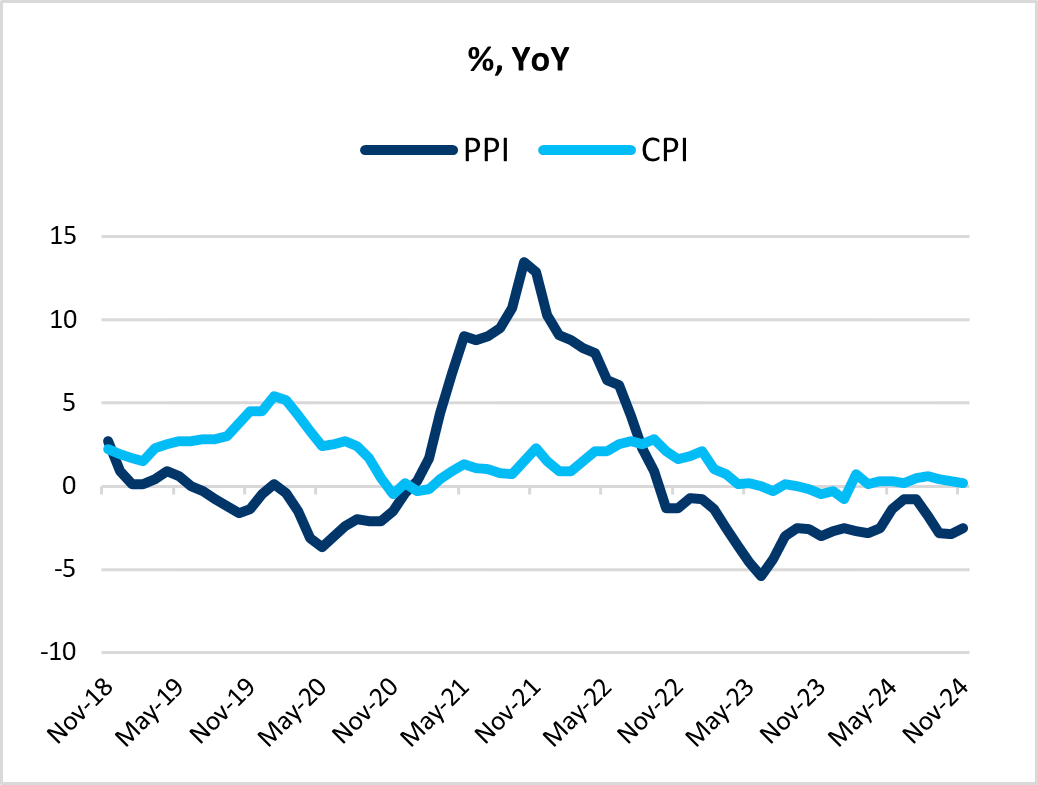
The Phase One Trade Agreement
On 15 Jan 20, the U.S. and China signed the so-called phase one trade deal targeting what Trump described as fair and reciprocal trade with key achievements including intellectual property, technology transfer, agriculture, financial services, and expanding trade. With the deal, tariffs on USD120bn of China’s U.S. bound exports were halved to 7.5%. Planned tariffs targeting another USD160bn were cancelled. With this, the average tariffs on Chinese goods imported to the U.S. was reduced to 13% from 15%.
We believe it is fair to assume that the phase one deal will be renegotiated potentially with trade hawk and former trade representative Robert Lighthizer’s Trump 1.0 plan a likely framework. If so, this would raise the average tariff on China’s U.S. bound exports to 22% from 13%. We note that Lighthizer’s former chief of staff, Jamieson Greer, has been selected by Trump to become Trade Representative.
In our opinion, a plausible scenario involves relatively high tariffs on intermediate goods, while consumer goods face lower tariffs.
China’s U.S. Bound Exports in Decline
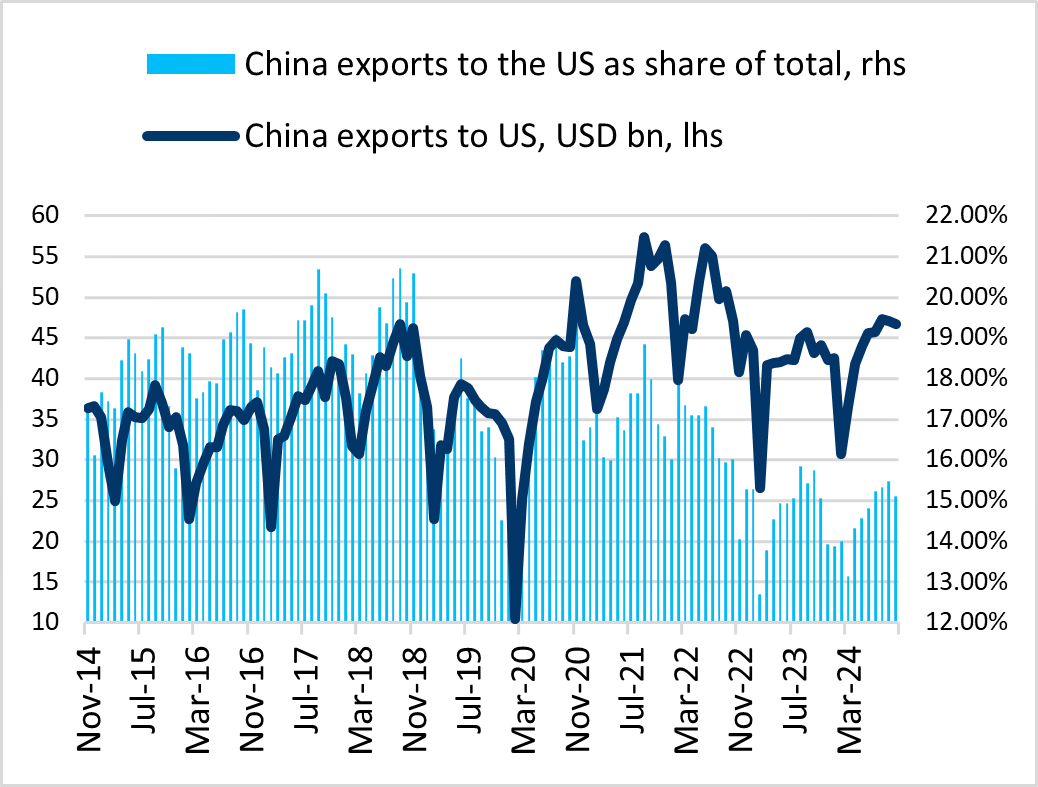
As of Oct 24, China’s exports to the U.S. account for 15% of its total exports, down from the 19% share observed in the two years preceding the 2018/2019 tariff announcements. In nominal terms, Chinese exports to the U.S. peaked at over USD50bn per month in 2018. However, as tariffs took effect, monthly exports dropped to USD30bn - USD35bn before the pandemic disrupted global trade in early 2020.
Today, China appears less vulnerable to U.S. tariffs than it was in 2017/2018.
China Could Weaponize Its Rare Metals
Donald Trump is arguably far better prepared to take office and address challenges with China in 2025 than he was in early 2017. However, China is also significantly more prepared for a trade war in 2025 compared to 2017-2018.
Hurting US farmers, China has taken steps diversify its agricultural imports, sourcing corn and wheat from Argentina, sorghum from Brazil, and cotton from Australia. Its grain reserves are overflowing, coinciding with a slowing economy that has dampened domestic demand. This time, China is prepared with record-high soybean stocks already secured domestically.
China is also preparing its bargaining chips. For instance, recently, shortly after the Biden-administration imposed restrictions on China’s access to components for AI chips, Beijing launched an investigation into Nvidia.
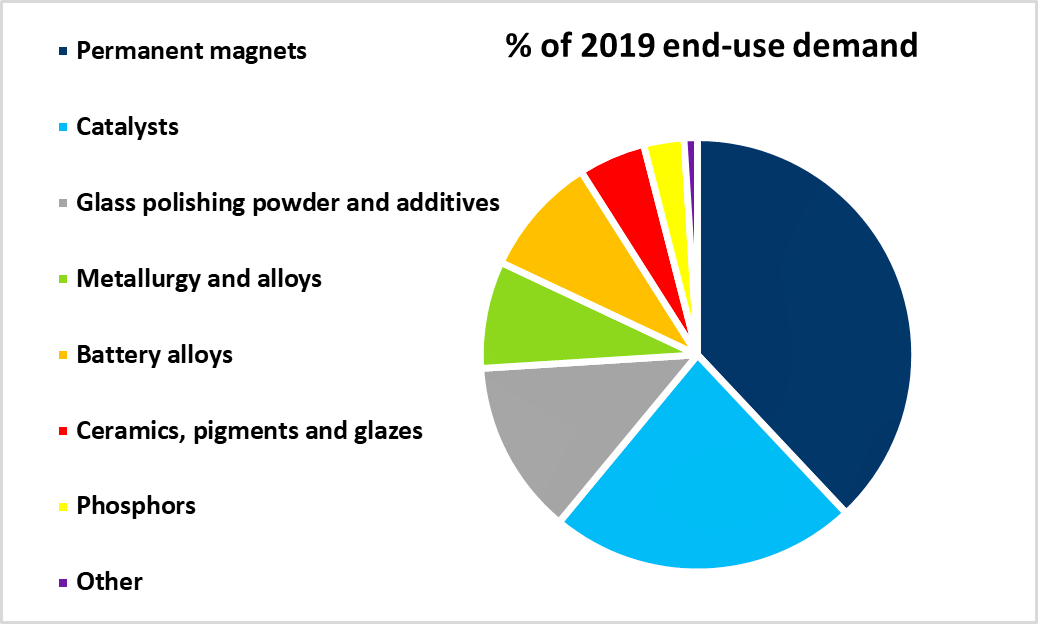
Additionally, signaling the potential weaponization of its dominance in rare metals, China has restricted the export of certain critical minerals to the U.S. and the EU.
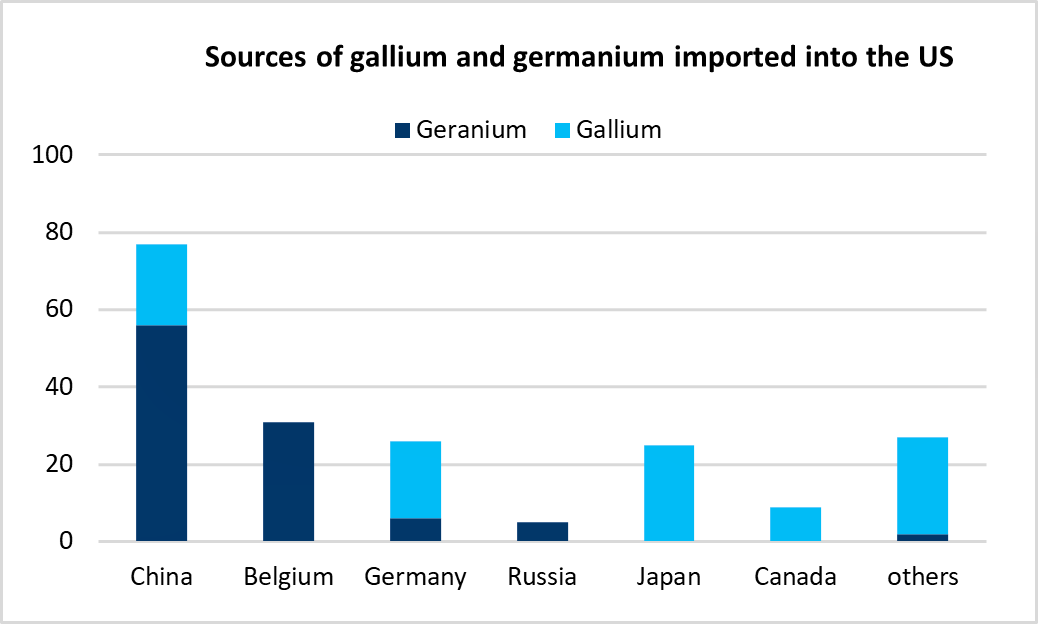
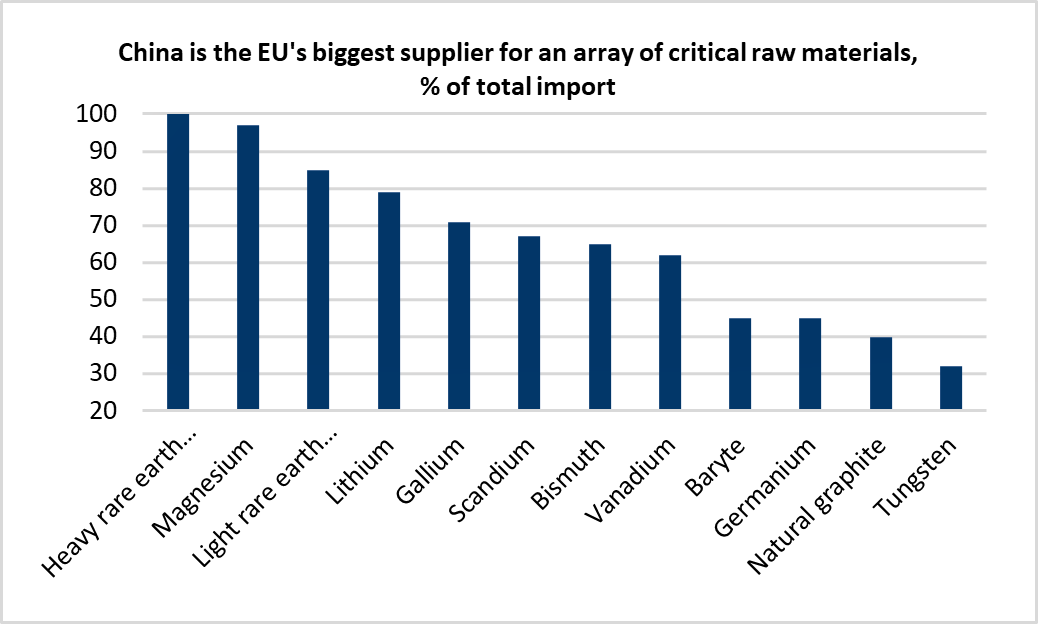
Rare earth metals are essential components in a wide range of products, including catalysts, magnets, and battery alloys.
The Chinese Economy Is at a Weaker Starting Point
Compared to 2018, China’s economy is starting from a weaker position to engage in a trade war. In 2018, GDP growth exceeded 1.5% quarter-on-quarter when tariffs impacted Chinese exports, whereas in 2024, growth averages around 1.0% quarter-on-quarter. At the same time, the official manufacturing PMI in 2018 ranged between 52 and 54, while the services PMI declined from a high of 54.4 to a still expansionary low of 52.3 heading into 2019. In 2024, both manufacturing and services PMIs are struggling to remain above the critical 50 mark, which separates expansion from contraction. However, Chinese authorities finally appear to recognize the need for fiscal action.
Are We Being Too Gloomy on Chinese Growth?
In Dec 24, the Chinese Politburo signaled a shift in monetary policy from "prudent" to "moderately loose," marking the first such change since the global financial crisis sent shockwaves through the economy. Additionally, the Politburo pledged to “boost consumption forcefully.”
These significant announcements followed the introduction of comprehensive measures in autumn 2024, which included monetary easing, housing market support, and initiatives to bolster equity markets and the banking sector. A debt swap was also introduced to ease the hidden debt burdens of local governments. However, these actions were more about stabilization than delivering a forceful stimulus targeting the domestic economy and consumption.
The market is now waiting for the Chinese government to follow through on its pledges and deliver stronger fiscal support, though specifics may only surface once there is greater clarity on tariffs.
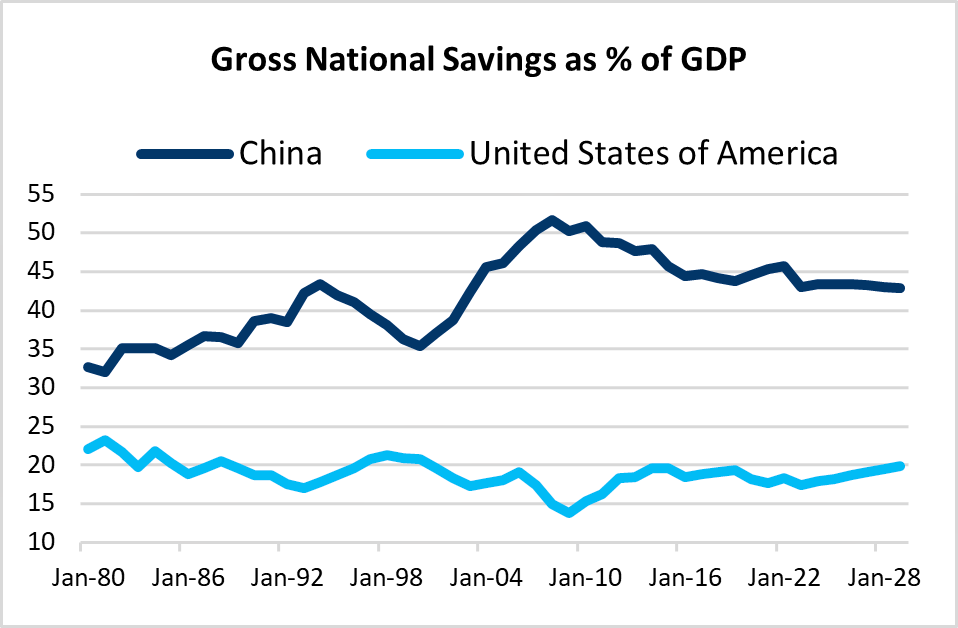
Addressing weak consumer sentiment will be particularly challenging but enhancing Medicare and social security could help redirect household savings -currently at 31% of income - toward consumption.
EM Outlook
In our base case for 2025, we anticipate U.S. growth to slow but remain healthy around 2%. Inflation is expected to ease slightly but will stay above the Fed's 2% target. The Trump administration’s tariff announcements are projected to push U.S. yields temporarily higher in Q1:25. In the Eurozone, growth should pick up from depressed levels, driven by increased fiscal spending, reduced political uncertainty.
The Fed is expected to lower interest rates twice in H1:25, bringing the upper bound of the Fed funds rate to 4%. Further moves will depend on the policy environment, including potential tax cuts and tariffs. We pencil in an additional rate cut in the second half of the year. Quantitative tightening is expected to conclude in Q1:25. Meanwhile, the ECB is likely to cut its policy rate at all meetings in H1:25 but might not go all the way to at terminal rate at 1.75% currently priced by the market by year-end 2025.
Emerging markets (EM) are expected to face pressure in early 2025 due to U.S. policy uncertainty, market volatility, and tariffs. However, as the year progresses, we anticipate a less confrontational stance from Trump toward EM economies than currently expected, which could provide relief and drive improvements in EM growth and market performance, excluding China.
Chinese growth is forecasted to hover around 4.5% in 2025, falling short of the official 5% target despite increased fiscal support. However, the efficiency and focus of fiscal spending could prove more significant than the amount spent.

We believe the current market environment is very tactical given the persistently high global macro, headline and geopolitical uncertainty. Such market circumstances call for a dynamic asset allocation overlay in EM fixed income portfolios. The ability to actively allocate between the various EMD segments in blended strategies should reduce drawdown risk and volatility, we believe. For 2025 we emphasize flexibility and strategies with a more idiosyncratic return profile.
When it comes to the broader emerging market landscape, no one is entirely Trumpproof and we will be monitoring key factors and potential risks associated with "Trumpenomics," including:
Rising U.S. Treasury yields
A significantly stronger USD
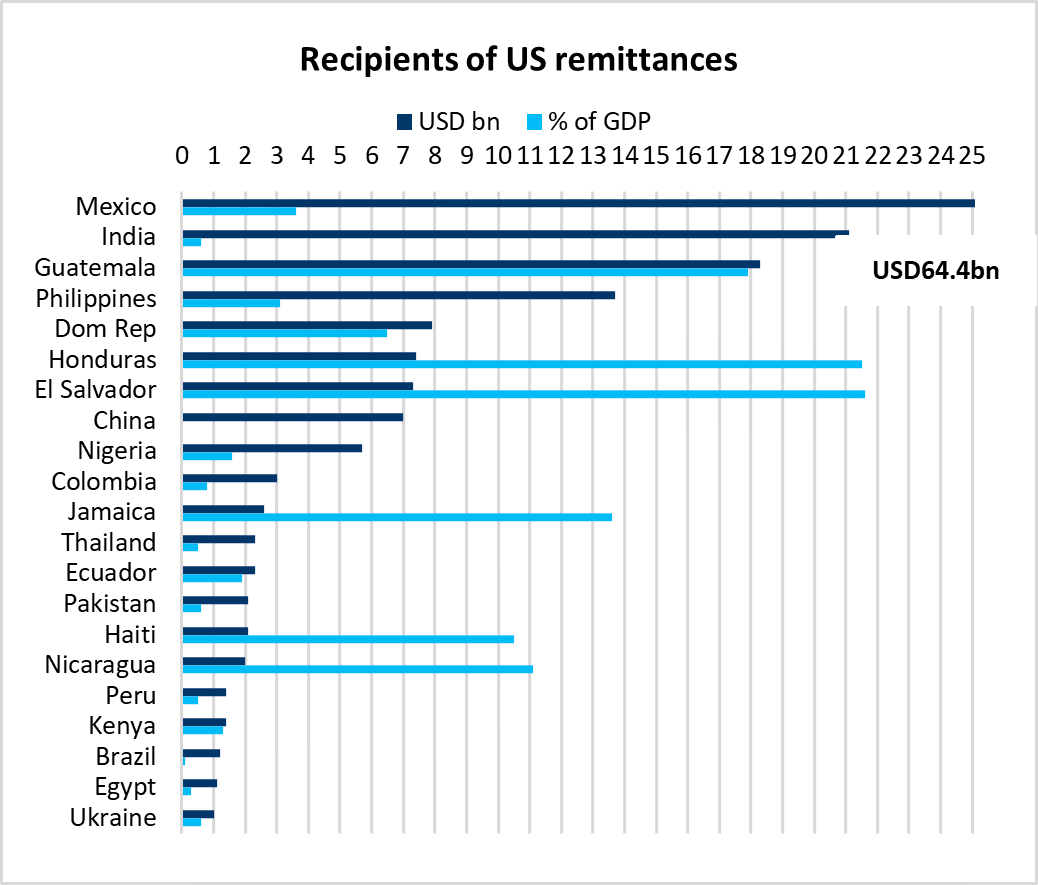
Challenges faced by remittance-dependent economies due to restrictions on U.S. immigration and potential taxation on remittances
Oil price tail risks
In our base case, we are not overly concerned about the risk of higher U.S. Treasury yields. In fact, we believe the market might be overly pessimistic in pricing a terminal effective Fed funds rate (mid-point rate) as high as 4.00%, not to be reached before mid-2027. Instead, we anticipate the effective Fed funds rate 3.625% will be reached in late 2025 as inflation nears its target and economic growth slows. If this scenario unfolds, market pricing for the terminal Fed funds rate should adjust downward. Such moderation should help 10-year yields to settle around 4.25%.
We anticipate that increased output from OPEC+ and non-OPEC producers will put downward pressure on WTI crude oil and gas prices, contributing to a slowdown in headline U.S. inflation.
This trend carries mixed implications for emerging market economies. In Frontier Markets, we have gradually shifted exposure from oil-producing to oil-importing countries. Among the larger Emerging economies, Turkey, South Africa and India will benefit from lower oil prices.
On the currency front, a stronger U.S. dollar remains a risk. However, the trade-weighted dollar is already historically elevated, and FX positioning indicates that markets have largely priced in the "Trump trade" while significantly lowering expectations for Fed funds rate cuts.
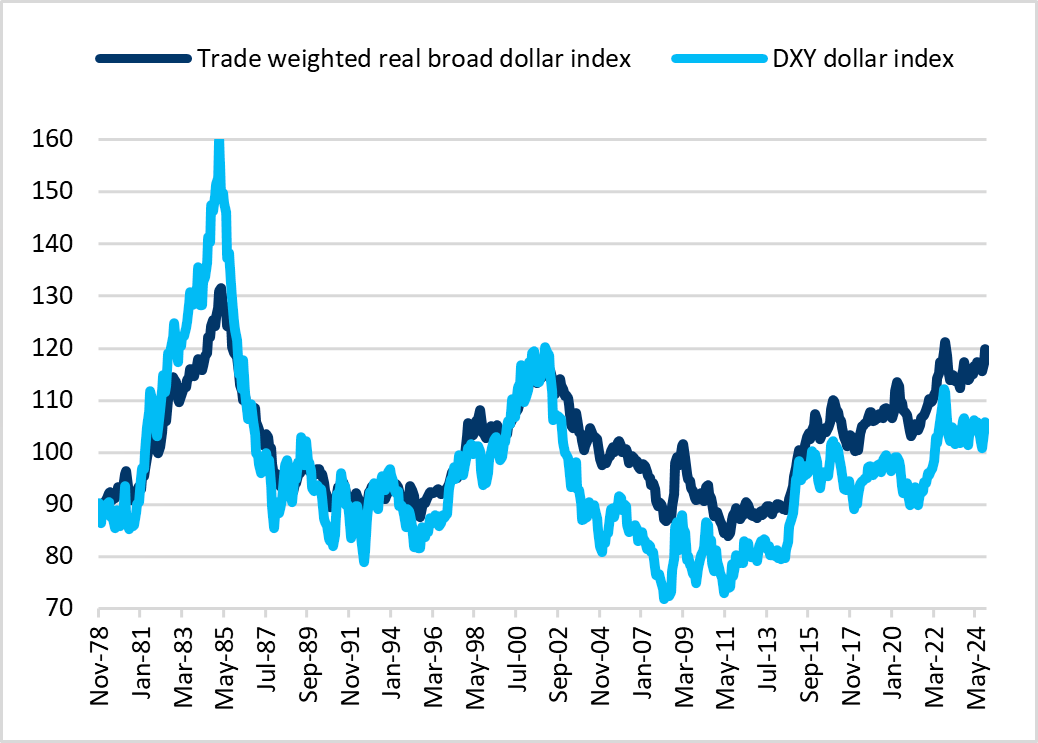
With a little help from Chinese fiscal efforts to support growth and a change in fortune in the Euro-area we see EUR/USD in 1.08 on a twelve-month horizon.
To support our thinking, pessimism on Eurozone growth outlook is widespread already but elections in Germany and France could prove a turning point as was the case in 2017. In Germany, the so-called debt brake could be loosened and in France, a budget compromise may prove better than feared. Anecdotical, in 2017 when Trump was in his first year as president the market was completely wrongfooted. Elections in France and Germany turned out market friendly and EUR/USD rose from 1.05 to 1.20.
Moreover, ECB’s Q4:24 bank lending survey and M3 monetary growth data suggest that lending standards are no longer tightened while demand for loans by companies has bottomed out and is picking up moderately. Net demand for housing loans rebounded strongly, while consumer credit demand increased more moderately.
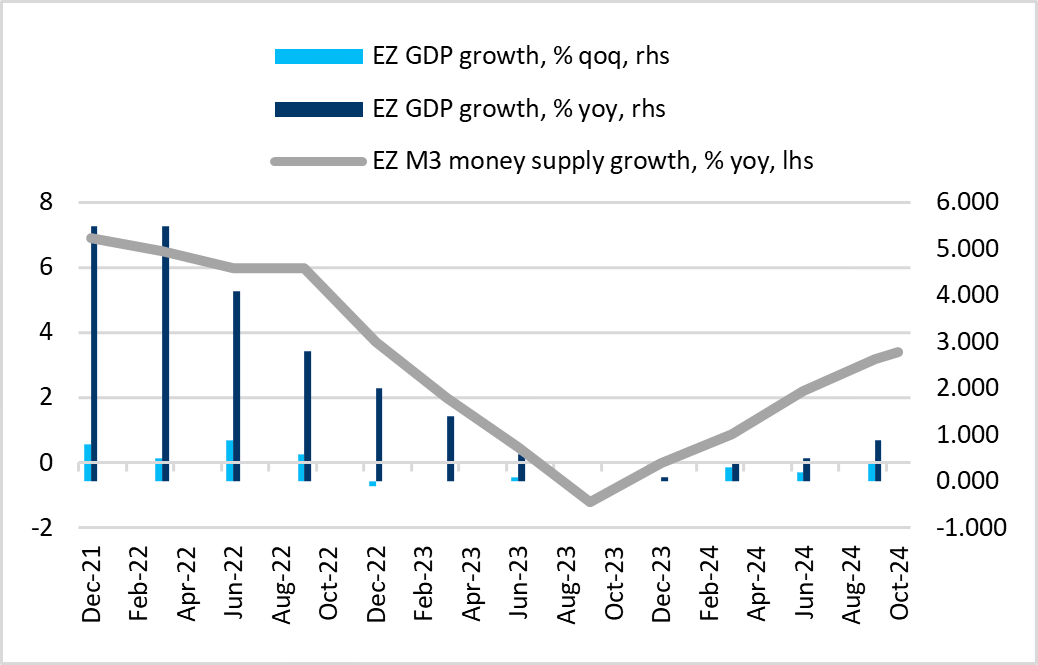
All of this suggests that the market may be too aggressive in pricing a 125bp rate cut in 2025. Also supporting the euro, we would highlight the underlying tailwind from the Euro-area current account balance.
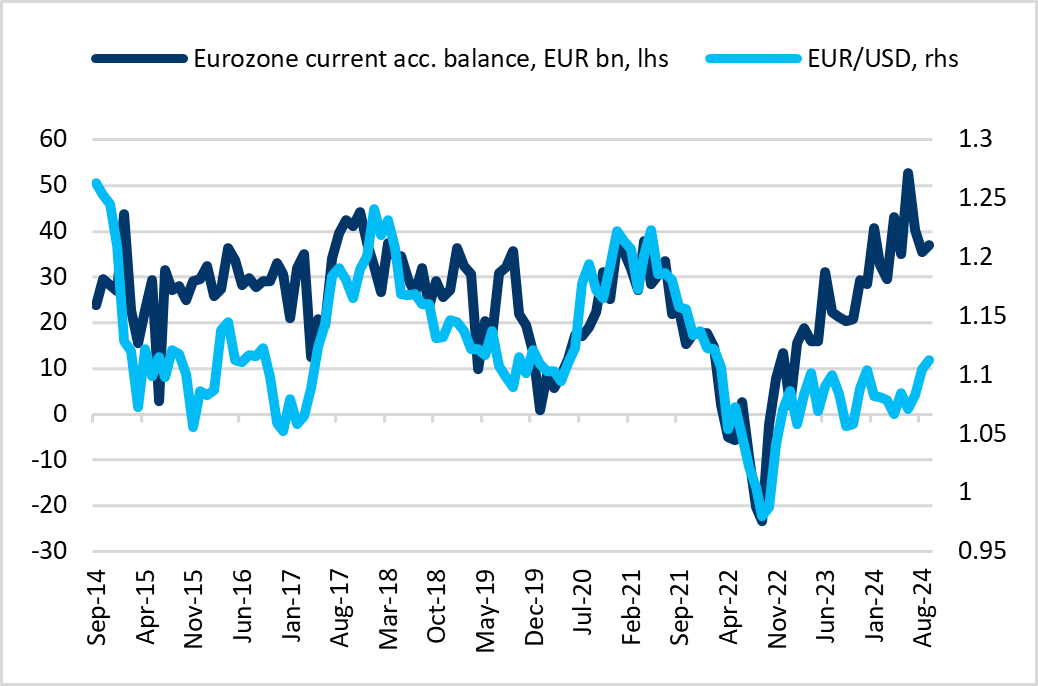
Finally, a ceasefire between Ukraine and Russia could pave the way for improved consumer sentiment across Europe and, over time, drive increased direct investment under the framework of a "Ukraine reconstruction".
In the scenario outlined above, CEE currencies are poised to benefit. However, this is likely a tactical trade requiring careful timing and flexibility.
Trump's protectionist policies, along with our baseline expectation of tariffs on goods from China, are likely to have an inevitable impact on export-driven economies, particularly in Asia. We see a significant risk of USD/CNY appreciating to 7.60 or higher, with spillover effects on other Asian currencies, many of which lack meaningful support from interest rate differentials relative to the U.S. dollar. As a result, we expect low-yielding Asian currencies to underperform against the GBI-EM FX index.
In contrast, the diversification of supply chains away from tariff-affected Chinese goods could support select currencies in Latin America. Additionally, if China continues to leverage its dominance in rare earth metals, regions like Latin America and Africa may benefit, potentially increasing output through heightened direct investment in mining.
We see value in Latin American local fixed income and FX, except for Mexico, where fiscal concerns weigh on our outlook.
Also, we are mindful that several Latin American countries, including Mexico, are reliant on remittance flows from immigrants working in the U.S. Mexico is by far the biggest recipient of US originated remittances with the share of remittances at 3.6% of GDP.
In the realm of hard currency debt, we see selective opportunities in EUR-denominated emerging market bonds, which are more closely correlated with Eurozone fixed income. For Euro-based investors, these bonds offer a potential saving of approximately 200bps annually in dollar hedging costs (based on 12-month EUR/USD forwards), while dollar-based investors can earn an additional 200bps by hedging EUR risk.
In Ukraine, we find macro-linked bonds undervalued, particularly given the possibility of macroeconomic targets being met under a ceasefire scenario.
While we view headline EMBIGD credit spreads as tight, we note a shift toward positive rating momentum. Sovereign credits like Oman and Serbia stand out as candidates with potential for an upgrade to investment grade.
In frontier markets, we prefer local currency debt over hard currency debt, as the latter offers fewer obvious opportunities following debt restructurings in 2024 and with local currency debt driven more by idiosyncratic themes and hence defensive by nature.
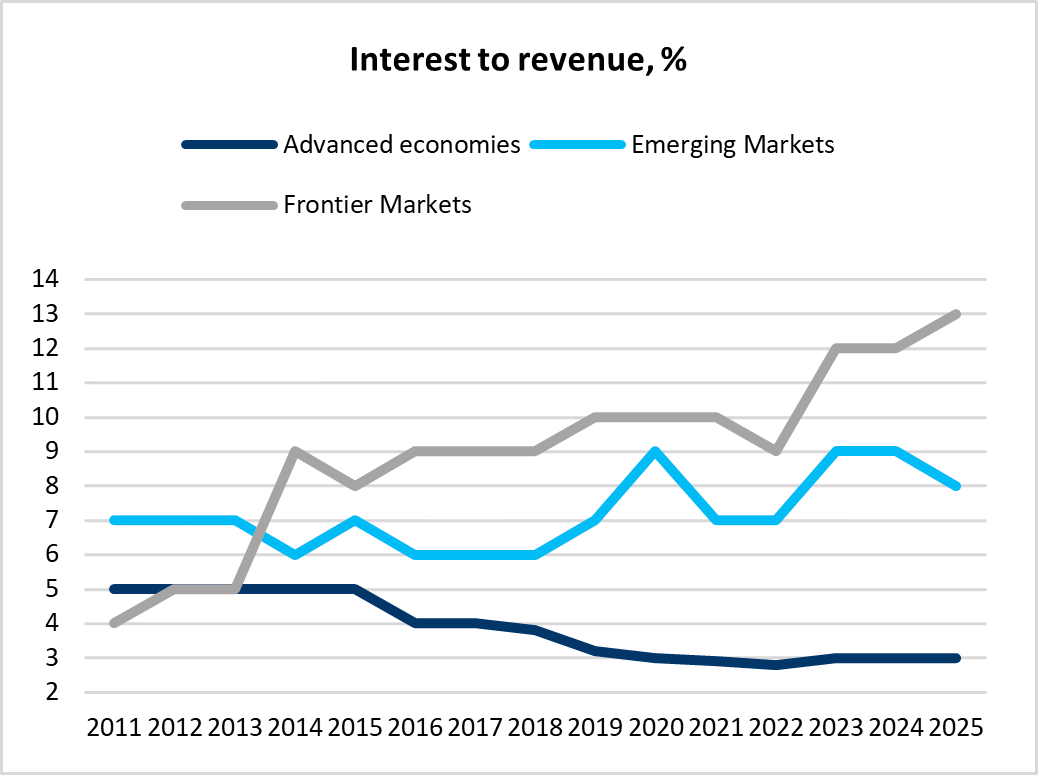
In this context, Moody's warned in its 2025 Outlook that while monetary policy is expected to ease gradually, governments will still refinance dollar debt in 2025 at relatively high rates. As a result, debt affordability for emerging and frontier markets will remain weaker than pre-pandemic levels, with significant challenges in frontier countries such as Pakistan, Nigeria, and Egypt. However, debt affordability will be less of a concern for more advanced economies.
EM Sovereign Issuance Calendar
Speaking of hard currency debt refinancing, sovereign debt amortizations are expected to rise in 2025, reaching USD93.2bn, up from USD70.6bn in 2024.
Regionally, amortizations are anticipated to remain stable in Asia, while increasing in EMEA and Latin America. In Latin America, amortizations are set to quadruple, growing from USD4bn to USD16bn.
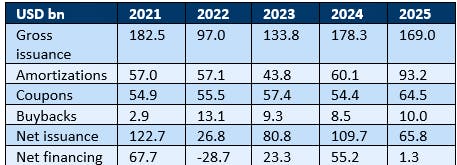
The largest amortizations in 2025 are expected from:
Turkey (USD12.7bn)
Indonesia (USD7.4bn)
Brazil (USD6.7bn)
On the issuance side, the highest activity is anticipated from:
Saudi Arabia (USD20.0bn)
Poland (USD16.5bn)
Romania (USD15.0bn)
Mexico (USD12.0bn)
In Sub-Saharan Africa (SSA), new issuance is expected from:
Egypt (USD2.0bn)
Nigeria (USD2.2 bn)
Angola (USD1.0bn)
Election Calendar
The 2025 election calendar is relatively light compared to 2024, which featured market-moving elections in Mexico, South Africa, and India.
In 2025, the most noteworthy elections are expected to be in Ecuador and Chile, alongside the German election. The latter could have significant implications not only for Germany but also for the broader EU and EUR/USD.
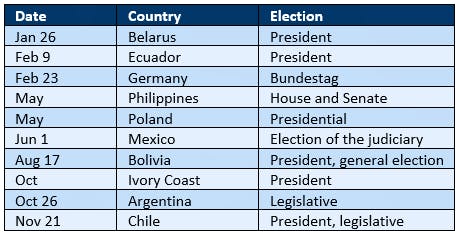
2025 elections still to be scheduled include:
• Czech Rep., legislative (October at the latest)
• Qatar, general (October at the latest)
A Final Thought
Donald Trump’s decisive return to the Oval Office has served as a wake-up call - not only for the Democratic Party but also for allies and adversaries of the U.S. around the world.
While we recognize that uncertainty remains high, this new reality also brings the potential for change. In the EU, it could spur politicians to coordinate fiscal and foreign policies, implement labor market and pension reforms, and create incentives for entrepreneurship and productivity.
In emerging markets, the market's reaction to Trump’s sweeping comeback serves as a warning to maintain fiscal discipline and reduce external vulnerabilities wherever possible.
One thing is certain: with Donald Trump back in the White House, 2025 promises to be anything but dull. We look forward to navigating the challenges and seizing the opportunities that will inevitably emerge.
Disclaimer & Important Disclosures
Global Evolution Asset Management A/S (“Global Evolution DK”) is incorporated in Denmark and authorized and regulated by the Finanstilsynets of Denmark (the “Danish FSA”). Global Evolution DK is located at Buen 11, 2nd Floor, Kolding 6000, Denmark.
Global Evolution DK has a United Kingdom branch (“Global Evolution Asset Management A/S (London Branch)”) located at Level 8, 24 Monument Street, London, EC3R 8AJ, United Kingdom. This branch is authorized and regulated by the Financial Conduct Authority under the Firm Reference Number 954331.
In the United States, investment advisory services are offered through Global Evolution USA, LLC (‘Global Evolution USA”), an SEC registered investment advisor. Registration with the SEC does not infer any specific qualifications Global Evolution USA is located at: 250 Park Avenue, 15th floor, New York, NY. Global Evolution USA is an wholly-owned subsidiary of Global Evolution Asset Management A/S (“Global Evolution DK”). Global Evolution DK is exempt from SEC registration as a “participating affiliate” of Global Evolution USA as that term is used in relief granted by the staff of the SEC allowing U.S. registered investment advisers to use investment advisory resources of non-U.S. investment adviser affiliates subject to the regulatory supervision of the U.S. registered investment adviser. Registration with the SEC does not imply any level of skill or expertise. Prior to making any investment, an investor should read all disclosure and other documents associated with such investment including Global Evolution’s Form ADV which can be found at https://adviserinfo.sec.gov.
In Singapore, Global Evolution Fund Management Singapore Pte. Ltd has a Capital Markets Services license issued by the Monetary Authority of Singapore for fund management activities. It is located at Level 39, Marina Bay Financial Centre Tower 2, 10 Marina Boulevard, Singapore 018983.
Global Evolution is affiliated with Conning, Inc., Goodwin Capital Advisers, Inc., Conning Investment Products, Inc., a FINRA-registered broker dealer, Conning Asset Management Limited, Conning Asia Pacific Limited and Octagon Credit Investors, LLC are all direct or indirect subsidiaries of Conning Holdings Limited (collectively, “Conning”) which is one of the family of companies owned by Cathay Financial Holding Co., Ltd., a Taiwan-based company. Conning has offices in Boston, Cologne, Hartford, Hong Kong, London, New York, and Tokyo.
Conning, Inc., Conning Investment Products, Inc., Goodwin Capital Advisers, Inc., Octagon Credit Investors, LLC, are registered with the Securities and Exchange Commission (“SEC”) under the Investment Advisers Act of 1940 and have noticed other jurisdictions they are conducting securities advisory business when required by law. In any other jurisdictions where they have not provided notice and are not exempt or excluded from those laws, they cannot transact business as an investment adviser and may not be able to respond to individual inquiries if the response could potentially lead to a transaction in securities. Conning, Inc. is also registered with the National Futures Association and Korea’s Financial Services Commission. Conning Investment Products, Inc. is also registered with the Ontario Securities Commission. Conning Asset Management Limited is authorised and regulated by the United Kingdom's Financial Conduct Authority (FCA#189316), Conning Asia Pacific Limited is regulated by Hong Kong’s Securities and Futures Commission for Types 1, 4 and 9 regulated activities
This publication is for informational purposes and is not intended as an offer to purchase any security. Nothing contained in this website constitutes or forms part of any offer to sell or buy an investment, or any solicitation of such an offer in any jurisdiction in which such offer or solicitation would be unlawful.
All investments entail risk and you could lose all or a substantial amount of your investment. Past performance is not indicative of future results which may differ materially from past performance. The strategies presented herein invest in foreign securities which involve volatility and political, economic and currency risks and differences in accounting methods. These risks are greater for investments in emerging and frontier markets. Derivatives may involve certain costs and risks such as liquidity, interest rate, market and credit.
This communication may contain Index data from J.P. Morgan or data derived from such Index data. Index data information has been obtained from sources believed to be reliable but J.P. Morgan does not warrant its completeness or accuracy. The Index is used with permission. The Index may not be copied, used, or distributed without J.P. Morgan's prior written approval. Copyright 2024, J.P. Morgan Chase & Co. All rights reserved.
While reasonable care has been taken to ensure that the information herein is factually correct, Global Evolution makes no representation or guarantee as to its accuracy or completeness. The information herein is subject to change without notice. Certain information contained herein has been provided by third party sources which are believed to be reliable, but accuracy and completeness cannot be guaranteed. Global Evolution does not guarantee the accuracy of information obtained from third party/other sources.
The information herein is not intended to provide, and should not be relied upon for, accounting, legal or tax advice or investment recommendations. This document does not constitute investment advice. The contents of this document represent Global Evolution's general views on certain matters, and is not based upon, and does not consider, the specific circumstance of any investor.
Legal Disclaimer ©2024 Global Evolution.
This document is copyrighted with all rights reserved. No part of this document may be distributed, reproduced, transcribed, transmitted, stored in an electronic retrieval system, or translated into any language in any form by any means without the prior written permission of Global Evolution, as applicable.
Copyright © 2026 Global Evolution - All rights reserved
