Dear visitor
You tried to access but this page is only available for
You tried to access but this page is only available for


Witold Bahrke
Senior Macro and Allocation Strategist
EM vs. DM inflation: Regime shift
In the aftermath of the pandemic, regime shifts are crystalizing in the global inflation landscape. While the dust from the pandemic has not completely settled, several global macro and policy factors supports our view that developed markets (DM) inflation will settle on a higher trend compared to pre-pandemic years. In addition, the gap between Emerging Markets (EM) and DM inflation is narrowing. In stark contrast to its DM counterpart, underlying EM inflation seems to settle close to its pre-pandemic trend. The reasons behind changing inflation patterns go beyond temporarily clogged supply chains in the aftermath of Covid. Historically, inflation has been a slow mover, exhibiting multi-year trends. This time is no different, in our view.
When dissecting the risk-reward of EM bond investing, inflation in both developed markets and emerging markets naturally has a key role to play. Consequently, a regime shift towards higher DM inflation and a narrower spread between EM and DM inflation would have wide-reaching implications for EM investors, particularly when it comes to local currency sovereign debt. So how has the global inflation landscape changed in the aftermath of the pandemic?
Topic du jour: DM inflation
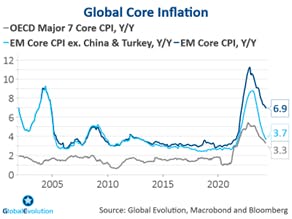
As a starter, let’s take a closer look at developed countries. After declining rapidly in 2022-23 (see appendix figure 1) from multi-decade highs, DM inflation is showing signs of levelling off markedly above the “lowflation” trend witnessed after the Great Financial Crisis (GFC), see chart below. As things stand, inflation is still markedly above most DM central bank’s inflation targets of around 2% annual price changes[1]. Several factors have contributed. While a deep-dive into the root cause of higher DM inflation is beyond the scope of this note, three of these factors are worth highlighting.
Firstly, structurally higher fiscal deficits with DM countries moving from fiscal conservatism to (in some cases pro-cyclical) fiscal largesse have a key role to play, in our view. Given a more direct impact on final demand, fiscal easing tends to be more inflationary than monetary easing.
Secondly, the changing contours of globalization rank high on the list of inflationary game-changers, as well. Rising geopolitical tensions have triggered a near- and friend-shoring trend in manufacturing. Ultimately, this limits China’s ability to export its own deflation to developed markets countries.
Demographics is the third key factor. A huge amount of retiring baby boomers in the developed world is limiting labour supply, structurally lifting wage pressures. In the US, this has been mitigated by large immigration flows as of late. But large immigration flows are unlikely to last given political pressures to curb the inflow of foreign-born workers ahead of the US election in November.
To be fair, poor demographics is not solely a DM phenomenon. On the EM side, China also struggles with a shrinking labour force. But as opposed to e.g. the demand-focused policy tilt in the US, China’s policy focus is firmly on stimulating the supply side. This has contributed to vast overcapacities in China’s manufacturing-driven economy. As a result, the inflationary impact of an ageing population in China has so far been much more limited as compared to the impact from demographics in service- and demand-driven DM economies like the US. Finally, the energy transition away from fossil fuels could also be listed as an important long-term driver behind higher DM inflation. However, it is less clear to which degree this factor mostly impacted DM or EM inflation.
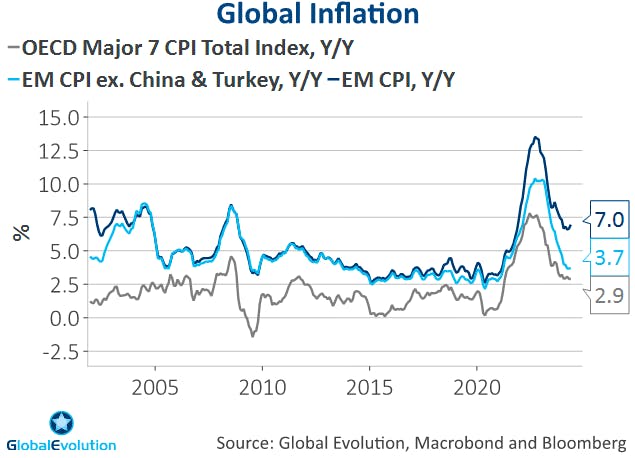
The main focus of this report is the difference between EM and DM inflation trajectories and what it means for EM fixed income. Clearly, with one part of the equation being DM inflation, the factors driving DM inflation higher should also be consequential for EM inflation. While there are no signs of hyper-inflation unfolding or a 70’s redux, none of the drivers behind higher DM inflation are short-lived in nature.
Under the radar: The EM-DM inflation gap
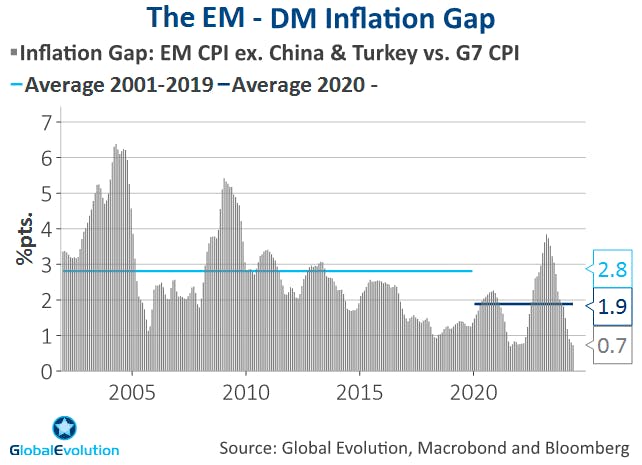
On top of higher DM inflation, the gap between EM and DM inflation has tightened. This becomes clear when looking at the different trajectories of EM and DM inflation in the post-pandemic years. The difference between average inflation in EM versus G7 inflation currently stands at a historical low of 0.7 %-Pt. as per chart below. In order to gauge the underlying trend in EM inflation, we have removed the extremes at both ends of the inflation distribution: China at the deflationary tail and Turkey on the inflationary end. On the one hand, a narrowing EM – DM inflation gap is driven by DM inflation shifting into higher gears after the pandemic. Lately, sticky US and Euro Area inflation have been poster children for this development, taking both central banks and large parts of the investor community by surprise. On the other hand, underlying EM inflation in and of itself has contributed to the tightening gap, as well. It came off the boil at a much faster clip than its DM counterpart and has largely managed to return to its pre-pandemic trend.
Although central banks and investors still struggle to adapt, persistently high DM inflation has kept investors awake at night for some time. In stark contrast, the gap between EM and DM inflation as such has caught far less attention among the investor community, although it might be equally as important for EM investors.
Cyclical or Structural narrowing? Policy is key
Why should investors pay attention? In short, because higher trend inflation in DM and a declining gap between EM and DM inflation most likely represents a structural shift rather than cyclical blip, with profound implications for strategic asset allocation. It seems unlikely to us that DM returns to the post-GFC lowflation era and the EM – DM inflation gap to its pre-pandemic levels anytime soon. The reasons behind are three-fold.
Firstly, on the DM side of the equation, we believe none of the drivers behind higher inflation are likely to fade anytime soon. When it comes to demographics, current retirement trends were determined decades ago. Geopolitical risks are still on the rise amid lingering conflicts and diverging interests between the two superpowers US and China. At the same time, the benefits from globalization as we know it are increasingly being questioned in a political context of rising populism, further fueling protectionism. Last, but not least, after years of fiscal prudence starting with the great moderation took hold in the 90’s, DM countries newfound fiscal largesse might still be in the early innings. Case in point, irrespective of who wins the US election, primary deficits are unlikely to be reduced much. Instead, the main question is what will keep them wide – fiscal spending or tax cuts. In DM, the fiscal genie is out of the bottle. It will be challenging to put it back. Altogether, a deteriorating policy backdrop makes for a moderately deteriorating growth-inflation trade-off in developed countries.
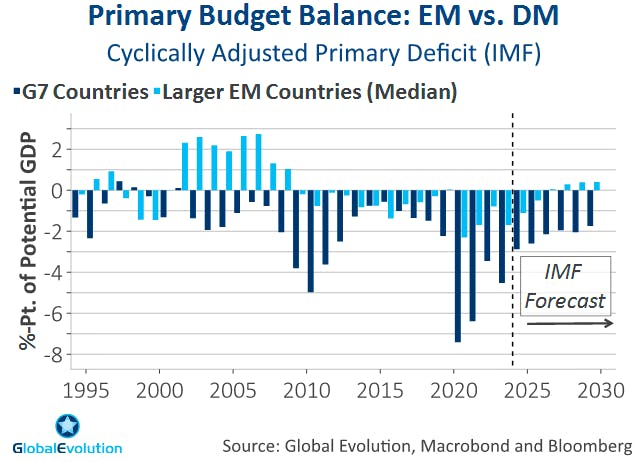
Secondly, in the aftermath of the pandemic, emerging markets have gained substantial policy credibility relative to DM. While some Fed watchers have speculated, that the US central bank might – either implicitly or explicitly – lift its inflation target, countries like Brazil or Indonesia have actually lowered their inflation targets over recent years. On the EM side of the equation, we therefore see an improving trade-off between growth and inflation. An important part of the story is a more tempered fiscal expansion during the recent years. As opposed to developed markets, there was no break-out of primary deficits, see chart below. A sounder fiscal policy foundation should reduce inflation risk and therefore contribute to a permanently tighter inflation gap between EM and DM.
Turning to monetary policy, the chart below highlights that EM central banks reacted more proactively to the most recent inflation shock, starting their hiking cycle earlier and more forcefully than their DM peers. This also enabled them to start cutting at an earlier stage.

The disciplined fiscal and monetary stance over recent years could be a one-off. And it almost goes without saying that there are and always will be worrying policy outliers among the EM crowd. The current political pressure on the independence of Brazil’s central bank is a brilliant example hereof. In the grand scheme of things, however, it seems that emerging market central banks by-and-large have learned their lessons from previous crisis episodes. As EM countries have suffered from the negative impact on their currencies in the past, a return to broad-based laissez-faire fiscal and monetary policy seems unlikely.
If we are right in extrapolating the fiscal and monetary policy reaction function over the recent years, it would mark a decisive improvement in the EM policy backdrop, as policy – both monetary and fiscal – historically has been one of the weaker spots of the EM universe relative to DM. As a result, inflation risks are set to decline structurally in EM.
Third, falling Chinese inflation contributes to a narrowing EM – DM inflation gap, failing to curb DM inflation. While the US currently is the reflationary epicenter in the global economy, China has arguably been the primary dis-inflationary pole among the major economies over the recent years. The root causes behind China’s disinflation are structural. The country has been stuck in a property crisis after years of overinvestment and overleveraging in real estate. Given high amounts of private savings tied to housing, the property slump is a major drag on household confidence. These headwinds prevent private consumption from boosting overall demand, keeping saving rates elevated and demand-driven inflation lower for longer.
Lately, policy makers have shown some signs of willingness to address the root causes of the property malaise. But despite anemic growth, policy-driven reflation is not in the pipeline. Stimulus efforts have been modest, at best. A possible explanation might be Beijing’s fear of spiraling Renminbi depreciation. A consumption revival would drive the current account into negative territory. Capital outflows and financial instability could be the consequence, putting pressure on FX – at least that seems to be the line of thinking in Beijing. The limited amount of stimulus announced so far has been guided in a decisively dis-inflationary direction. Instead of the property sector and household demand, policy makers have prioritized supporting the manufacturing sector, expanding existing overcapacities.
From a global perspective, near-shoring production in order to safe-guard supply chains against geopolitical risks and increasing trade barriers are not only fueling structural inflation in DM, limiting China’s disinflationary spill-overs to DM [see also here]. It is also amplifying existing overcapacities in China. In the current geopolitical context, China therefore can be counted as an additional driver behind both structurally higher DM inflation and a narrower EM-DM inflation gap – despite several years of dis-inflation and in stark contrast to the pre-pandemic era. The below chart shows, the inflation gap has had a positive and increasing beta to lagged Chinese inflation. In an era of deflation in the world’s second biggest economy, this simple analysis implies China added to the narrowing spread between EM and DM inflation.

Mind the gap: 3 take-aways for investors
How does a structurally tighter gap between EM and DM inflation impact the EM fixed income investment landscape? We see three main takeaways.
Firstly, a narrower inflation gap should mitigate the depreciation trend of EM currencies over recent years. The narrowing inflation gap will increase EM real yields relative to DM real yields, all else being equal. Higher real yields lend support to EM currencies, which have been on a downtrend since 2012. The real interest differential model[2] helps to explain the relationship between currencies and real yields. According to the model, a tighter long-run expected inflation differential result in an appreciating exchange rate. Clearly, exchange rates are impacted by a plethora of other factors, not covered by such a model. A more supportive EM-DM real yield in and of itself might not be enough to turn a multi-year downtrend in EM FX around. However, a more favorable EM-DM real interest rate differential should e.g. help to counterbalance the negative impact on EM currencies from other factors such as the peak in China’s downward sloping growth path, reducing the overall headwinds on that front.
Over the past 10 years, returns in EM local currency sovereign bonds have trailed those from EM hard currency sovereign bonds. Going forward, FX should be less of a drag. From a strategic investment perspective, the upshot for EM investors are higher expected returns in local currency EM debt over the coming 1-3 years as compared to the previous decade.

The difference between the realized volatility of EM local currency bonds and G7 government bonds has declined as the gap between EM and DM inflation has narrowed over the last few years as below chart highlights. Less volatility in and of itself improves the Sharpe ratio of EM local currency bonds. To the degree that the overall volatility in EM bonds declines, it should also result in more attractive diversification when adding EM bonds to global bond portfolios.

Lastly, transitioning into a macro environment with a lower inflation gap between Emerging Market countries and Developed Markets implies that capital gains should play a more prominent role in the total return composition of local currency EM sovereign debt. Historically, return contributions from high carry have been the primary driver behind investor’s interest for the asset class. This will continue to be the case, especially in frontier countries. But on top of the carry allure in EM debt, relatively lower inflation risks backed by a more credible policy foundation and structural disinflationary waves in China should support local currency EM debt’s duration risk premiums relative to DM peers.
To be clear, we do not expect a seismic shift lower in EM yields. Still, the different return drivers should behave in a more balanced way in the transitioning period towards higher DM inflation and a tightening EM-DM inflation gap. Some pundits have called the end of total return strategies in bonds as DM yields have hit a structural low point, implying that the prospect of price appreciation is more tactical rather than structural. In Emerging Markets, however, investors might increasingly add a capital gain aspect to their assessment of the asset class rather than viewing EM bonds solely through the carry lens.
EM local debt: Moving out of the doghouse
The bottom line, in our view, is that local currency EM sovereign debt stands to benefit in absolute and relative terms from the regime shift taking place in the inflation landscape.
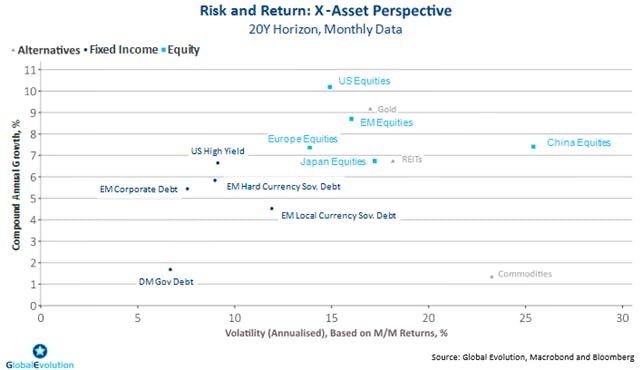
We believe the gap between EM and DM has narrowed not only cyclically, but structurally with profound long-term consequences for EM bond investors. Looking ahead, structural depreciation pressure on EM FX should abate and the volatility gap between local currency EM debt and DM bonds tighten relative to the pre-pandemic era. As a result, we believe risk-reward and diversification merits of local currency bonds are set to improve. Mapped into a variance-return framework (appendix figure 6), the asset class should improve relative to other bond segments. EM local government bonds have lagged their hard currency peers for years. From a strategic return perspective, the worst should be behind. Going forward, we believe it’s time to rethink their role relative to other EM debt segments, but also in a broader asset allocation context.
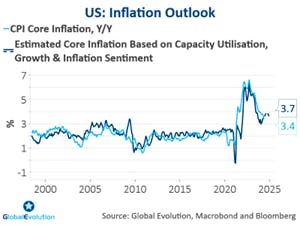
[1] Quantifying the medium-term lift to US core inflation as an example, our medium-term inflation model suggests core inflation to be 1-1½%-pts. higher compared to the post-GFC period, see appendix figure 4. naturally, these estimates have to interpreted with caution during times of structural shifts and, hence, unstable model parameters.
[2] Frenkel, J. (1976). ‘A Monetary Approach to the Exchange Rate: Doctrinal Aspects and Empirical Evidence’. Scandinavian Journal of Economics, Vol.76, pp. 200-224


Disclaimer & Important Disclosures
Global Evolution Asset Management A/S (“Global Evolution DK”) is incorporated in Denmark and authorized and regulated by the Finanstilsynets of Denmark (the “Danish FSA”). Global Evolution DK is located at Buen 11, 2nd Floor, Kolding 6000, Denmark.
Global Evolution DK has a United Kingdom branch (“Global Evolution Asset Management A/S (London Branch)”) located at Level 8, 24 Monument Street, London, EC3R 8AJ, United Kingdom. This branch is authorized and regulated by the Financial Conduct Authority under the Firm Reference Number 954331.
In the United States, investment advisory services are offered through Global Evolution USA, LLC (‘Global Evolution USA”), an SEC registered investment advisor. Registration with the SEC does not infer any specific qualifications Global Evolution USA is located at: 250 Park Avenue, 15th floor, New York, NY. Global Evolution USA is an wholly-owned subsidiary of Global Evolution Asset Management A/S (“Global Evolution DK”). Global Evolution DK is exempt from SEC registration as a “participating affiliate” of Global Evolution USA as that term is used in relief granted by the staff of the SEC allowing U.S. registered investment advisers to use investment advisory resources of non-U.S. investment adviser affiliates subject to the regulatory supervision of the U.S. registered investment adviser. Registration with the SEC does not imply any level of skill or expertise. Prior to making any investment, an investor should read all disclosure and other documents associated with such investment including Global Evolution’s Form ADV which can be found at https://adviserinfo.sec.gov.
In Singapore, Global Evolution Fund Management Singapore Pte. Ltd has a Capital Markets Services license issued by the Monetary Authority of Singapore for fund management activities. It is located at Level 39, Marina Bay Financial Centre Tower 2, 10 Marina Boulevard, Singapore 018983.
Global Evolution is affiliated with Conning, Inc., Goodwin Capital Advisers, Inc., Conning Investment Products, Inc., a FINRA-registered broker dealer, Conning Asset Management Limited, Conning Asia Pacific Limited and Octagon Credit Investors, LLC are all direct or indirect subsidiaries of Conning Holdings Limited (collectively, “Conning”) which is one of the family of companies owned by Cathay Financial Holding Co., Ltd., a Taiwan-based company. Conning has offices in Boston, Cologne, Hartford, Hong Kong, London, New York, and Tokyo.
Conning, Inc., Conning Investment Products, Inc., Goodwin Capital Advisers, Inc., Octagon Credit Investors, LLC, are registered with the Securities and Exchange Commission (“SEC”) under the Investment Advisers Act of 1940 and have noticed other jurisdictions they are conducting securities advisory business when required by law. In any other jurisdictions where they have not provided notice and are not exempt or excluded from those laws, they cannot transact business as an investment adviser and may not be able to respond to individual inquiries if the response could potentially lead to a transaction in securities. Conning, Inc. is also registered with the National Futures Association and Korea’s Financial Services Commission. Conning Investment Products, Inc. is also registered with the Ontario Securities Commission. Conning Asset Management Limited is authorised and regulated by the United Kingdom's Financial Conduct Authority (FCA#189316), Conning Asia Pacific Limited is regulated by Hong Kong’s Securities and Futures Commission for Types 1, 4 and 9 regulated activities
This publication is for informational purposes and is not intended as an offer to purchase any security. Nothing contained in this website constitutes or forms part of any offer to sell or buy an investment, or any solicitation of such an offer in any jurisdiction in which such offer or solicitation would be unlawful.
All investments entail risk and you could lose all or a substantial amount of your investment. Past performance is not indicative of future results which may differ materially from past performance. The strategies presented herein invest in foreign securities which involve volatility and political, economic and currency risks and differences in accounting methods. The information included in the Report may contain statements related to future events or developments that may constitute forward-looking statements. These statements may be in the form of financial projections or may be identified by words such as "expectation," "anticipate," "intend," "believe," "could," "estimate," "will," "should" or words of similar meaning. Such statements are based on the current expectations and certain assumptions of the author and are, therefore, subject to certain risks and uncertainties. These risks are greater for investments in emerging and frontier markets. Derivatives may involve certain costs and risks such as liquidity, interest rate, market and credit.
The scenarios shown are hypothetical only and are not predictive of future events. The use of hypothetical scenarios and forecasts has inherent limitations, including but not limited to, their inability to reflect the impact of actual trading on a portfolio or economic and market factors on investment decisions. They rely on opinions, assumptions and mathematical models, which can turn out to be incomplete or inaccurate. These opinions and assumptions are often based on past events and do not consider unforeseen events or developments. Global Evolution makes no representation that this is the expected return of any portfolio and you should expect actual performance to differ. Scenarios do not deduct trading costs and other fees and expenses. All charts presented above are shown for illustrative purposes only.
This communication may contain Index data from J.P. Morgan or data derived from such Index data. Index data information has been obtained from sources believed to be reliable but J.P. Morgan does not warrant its completeness or accuracy. The Index is used with permission. The Index may not be copied, used, or distributed without J.P. Morgan's prior written approval. Copyright 2024, J.P. Morgan Chase & Co. All rights reserved.
While reasonable care has been taken to ensure that the information herein is factually correct, Global Evolution makes no representation or guarantee as to its accuracy or completeness. The information herein is subject to change without notice. Certain information contained herein has been provided by third party sources which are believed to be reliable, but accuracy and completeness cannot be guaranteed. Global Evolution does not guarantee the accuracy of information obtained from third party/other sources.
The information herein is not intended to provide, and should not be relied upon for, accounting, legal or tax advice or investment recommendations. This document does not constitute investment advice. The contents of this document represent Global Evolution's general views on certain matters, and is not based upon, and does not consider, the specific circumstance of any investor.
Legal Disclaimer ©2024 Global Evolution.
This document is copyrighted with all rights reserved. No part of this document may be distributed, reproduced, transcribed, transmitted, stored in an electronic retrieval system, or translated into any language in any form by any means without the prior written permission of Global Evolution, as applicable.
Copyright © 2025 Global Evolution - All rights reserved
