Dear visitor
You tried to access but this page is only available for
You tried to access but this page is only available for


Michael Nguyen
Lead of Quantitative Research
Tactical investing, which involves making short-term adjustments to an investment portfolio based on market fluctuations, can be a double-edged sword.
While it has the potential to generate superior returns compared to buy-and-hold investing, it often proves elusive in major financial markets due to several factors including market unpredictability, behavioral biases, and the complexity of executing tactical strategies effectively. However, there may be opportunities in lesser efficient, more volatile markets as recently noted by Asness (2024), particularly with the advent of noisy social media which can increase volatility – and opportunity.
With more than 100 countries in its universe and dozens of liquid government and corporate bond markets, Emerging Market Debt (EMD) may be one of those lesser efficient asset classes that often is driven by investor reactions to dramatic media headlines. Indeed, there is evidence that some modest rotation and rebalancing in hard currency and local currency opportunities could generate meaningful outperformance over a long-time horizon.
Knowing When to Hold 'Em, When to Fold 'Em?
One of the primary advantages of tactical investing is the opportunity to capitalize on market inefficiencies often found in EMD. According to research by Sharpe (1992), tactical asset allocation can yield higher returns than a static, long-only approach by taking advantage of price discrepancies and trends in various asset classes. For instance, during risk-off periods, tactical investors may reposition their portfolios to reduce exposure to less risky assets or cash, to mitigate losses. Conversely, as markets recover, they can shift back to riskier securities to capture the possible dislocation in market prices. This ability to move in and out of asset classes based on market sentiment can lead to superior investment performance over time - particularly in those that often create excessive nervousness, like Emerging Markets.
However, execution is critical. Tactical investing requires precise timing, informed decision-making, and rigorous market analysis. As noted by Fama and French (2004), even slight misjudgments in allocation timing can have significant impacts on overall returns. Successful tactical investors often utilize quantitative models, trend-following strategies, and key economic indicators to inform their decisions, striving to enter or exit markets before major price movements occur.
The challenge arises in the form of market unpredictability. Unlike long-only investing, which relies on a buy-and-hold strategy that assumes a general upward trend in asset prices, tactical investing must contend with short-term volatility and unforeseen economic events. For instance, the COVID-19 pandemic in early 2020 created unprecedented market turbulence that challenged even the most seasoned tactical investors.
According to Tsai et al. (2021), many investors struggled to maintain their positions or adjust in time to avoid losses during rapid market shifts, demonstrating the inherent risk in tactical strategies. Behavioral biases also play a crucial role in the effectiveness of tactical investing. Investors often fall prey to emotions, such as fear and greed, leading to poor timing decisions. Kahneman and Tversky (1979) highlighted how cognitive biases could cause investors to misinterpret market signals or become overly confident in their strategies. This can result in tactical investors missing crucial market opportunities or making hasty decisions that add to their costs, ultimately detracting from potential profits – again, something witnessed frequently in volatile Emerging Markets.
In contrast, buy-and-hold investing offers simplicity and reduced stress. Investors in this category often focus on fundamental analysis and benefit from compounding returns over time.
However, the potential for superior returns in tactical investing cannot be understated. In an early study by Brown and Goetzmann (1995), the authors found that tactical strategies, when executed correctly, significantly outperformed their long-only counterparts over various market cycles. The key takeaway is that, while tactical investing presents challenges, those who possess a disciplined approach and leverage the right tools can exceed the average market returns.
The EMD Opportunity: 2004-2024
How would such a strategy have played out in EMD, rotating through the three broad areas of (1) hard currency sovereign, (2) local currency sovereign, and (3) hard currency corporate bonds?
To test the idea of trying to profit from market opportunities, we propose a model identifying four distinct risk regimes: Goldilocks (characterized by rising growth and declining inflation), Reflation (growth and inflation both on the rise), Stagflation (falling growth with rising inflation), and Recession (both growth and inflation in decline).
To systematically classify market regimes, we apply our customized Principal Component Analysis (PCA) to a set of 30 macro-financial factors including equites, fixed income, commodities and VIX, among others, observed at a monthly frequency. The first two principal components (PC1 and PC2) capture the dominant sources of variation in global macro conditions and market sentiment.
PC1 reflects a broad global risk sentiment signal. It is interpreted as a “risk-on/risk-off” axis:
When PC1 is above its 5-month moving average, the market is in a risk-on state, consistent with improving global growth conditions and investor appetite for risk.
Conversely, when PC1 is below its 5-month moving average, it signals a risk-off environment, typically associated with deteriorating growth and tighter financial conditions.
PC2 is interpreted as a proxy for demand for bonds and duration, typically linked to inflation dynamics and monetary policy expectations:
When PC2 is rising, it reflects stronger demand for bonds, often associated with disinflationary trends and expectations of policy easing.
When PC2 is falling, it suggests weaker bond demand, typically seen in reflationary environments or during inflationary shocks.
In turn, we define the investable EMD universe to include two core risks segments per delineated asset class: “Local Low Yield” (LLY) and “Local High Yield” (LHY) for local currency bonds, “Hard Currency Government Investment Grade” (GIG) and “Hard Currency Government High Yield”(GHY) for sovereign hard currency bonds, and Hard Currency Corporate Investment Grade (CIG) and High Yield (CHY) for hard currency corporate bonds.
The GIG and CIG are defined as the bonds in JP Morgan’s key EMD indices with a rating of BBB- or higher in the government and corporate sectors respectively. The higher risk GHY and CHY segments are bonds in those in the indices rated BB+ or lower.
With these six defined asset classes, we then attempt to compare the risk and return of a static buy-and-hold benchmark portfolio against a tactical regime-switching model. This model adjusts allocations dynamically, emphasizing riskier, high-yield assets (LHY, GHY, and CHY) during Goldilocks and Reflation periods and shifting focus to safer, investment-grade assets (LIG, GIG, and CIG) in Stagflation or Recession environments.
When the regime is either in Goldilocks or Reflation (risk-on periods), the model allocates 100% to its respective high-risk pool in the next month. When the regime is in Stagflation or Recession (risk-off periods), the model rebalances 100% into their lower risk portfolios.
The Results Are In
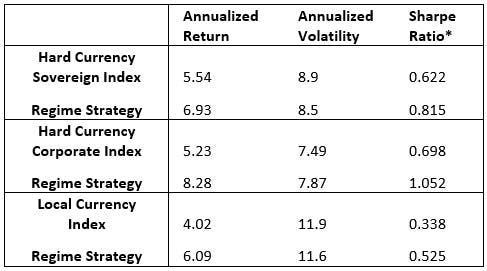
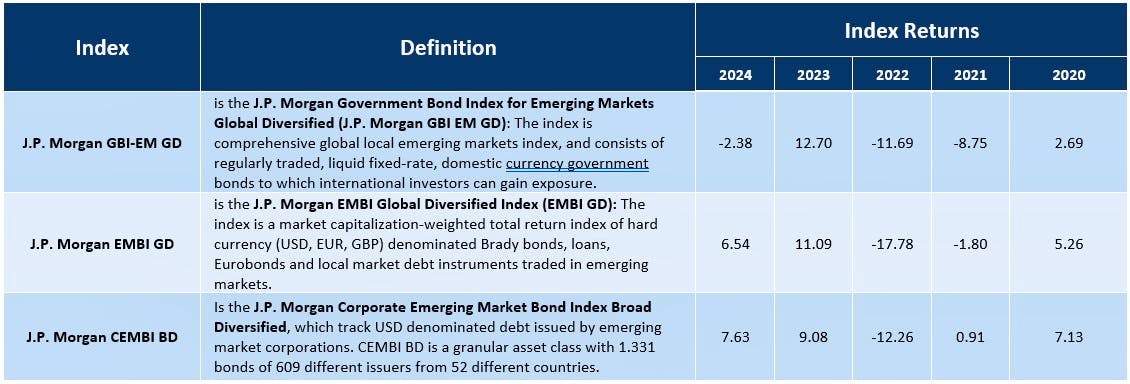
Hard Currency Sovereign: Using the economic indicators as signals for shifting to different risk-weighted portfolios vs. JP Morgan EMBIGD benchmark (Please refer to index definition in table 2)for 240 months, we noted that our allocation changes generated an annualized gross return of 6.93% or +1.49% more than those of the benchmark. Moreover, volatility was reduced modestly from 8.90% to 8.50%, boosting a Modified Sharpe Ratio from .62 to .81. The cost for such allocation changes was a small increase in maximum drawdown, from 25.85% to 26.27%. In short, the model produced gross returns that would have generated 92nd-percentile performance for the 20-year period in the eVestment universe and 63rd percentile for the trailing 5-year period.
Hard Currency Corporate: In the hard currency corporate bond sector, we note that our allocation signal changes again proved worthwhile. The annualized return recorded 8.28% or 3.05% more than that of the benchmark JPM CEMBI Broad Diversified (Please refer to index definition in table 2).
Part of this can be attributed some excessive volatile periods, such as the Global Financial Crisis, when the system captured some significant de-risking and re-risking opportunities. Again, volatility was marginally higher at 7.87% to 7.49%, which lead to better Modified Sharpe Ratio from .70 to 1.05. Interestingly, for hard currency corporates the regime strategy helped reduced the drawdown significantly from 24.30% to 20.75%. In short, the model produced gross returns that would have ranked in the 93rd percentile performance for the 10-year period compared to the eVestment universe of managers (a universe with a much shorter track record than that for Hard Currency Sovereign managers), and 91-percentile the trailing 5-year period.
Local Currency Sovereign: In the local currency sovereign sector, our allocation signal changes also generated better results: Annualized return of 6.09% - or 2.07% more than that of the benchmark which is JP Morgan GBIEMGD (Please refer to index definition in table 2). Again, regime volatility fell from 11.90% for the benchmark to 11.60%, improving the Modified Sharpe Ratio from .34 to .52. Maximum drawdown was also curbed from 29.32% to 28.02% . In short, the model produced gross returns that would have ranked in the 89th percentile performance for the 10-year period (again, a universe with a shorter track record) compared the eVestment universe of managers and 35th percentile for the 5-year period.
Please note: The model performance presented above, as well as in Table 1 below, is shown on a gross-of-fees basis. Similarly, peer group performance figures are also reported gross of fees. Prospective investors considering a strategy similar to the one depicted in the model should be aware that actual returns will be reduced by the deduction of management and other applicable fees.
Discussion
In aggregate, the allocation switching models generated positive outcomes relative to their respective benchmarks, not only by enhancing returns but also by improving risk-adjusted statistics across all three Emerging Market Debt asset classes over the 2004–2024 period. It is important to note that this outperformance did not materialize in every individual year, as market risk regimes can begin and end at arbitrary points, independent of the calendar year. Consequently, one should not anticipate any risk regime-following model to outperform benchmarks on an annual basis. This characteristic may also affect short-term peer rankings, as the rules-based model operates independently of the calendar year.
A review of each asset class reveals several insights warranting further discussion. Firstly, tracking error associated with such strategies tends to be relatively high for fixed income asset classes. This is logical, given the aggressive rotations and the unpredictability of risk regimes, but it also reflects the investment style common among EMD managers in comparatively volatile markets. Furthermore, portfolio rotations are determined using 30 factors, which can result in both premature and delayed adjustments that may miss sudden market inflections—factors that also contribute to elevated tracking error.
Hard Currency Sovereign debt, whose benchmark features relatively long duration, registered a tracking error of 3.23% and an information ratio of 0.43. For the Local Currency strategy, the tracking error was notably higher, at 6.45%—almost double that of the Hard Currency Sovereign strategy. As a consequence, its information ratio was lower at 0.32, despite the strategy generating higher excess return. Although these levels may appear elevated, they are not atypical in developing markets. The higher tracking error is more understandable when considering that the Hard Currency index is substantially more diversified than the Local index, and all assets are denominated in a single currency—the US dollar. With more than 70 issuing countries, Hard Currency assets, unified by currency, are more correlated, even across different risk pools, than their local currency counterparts. By contrast, the Local Currency universe, with fewer than 20 index countries, results in high and low-risk pools that are more concentrated than those of Hard Currency, thereby increasing idiosyncratic risk. Additionally, foreign exchange rates in emerging markets tend to exhibit lower correlation than Hard Currency assets, collectively contributing to greater volatility and higher tracking error.
It is also noteworthy that the Hard Currency Corporate strategy recorded a tracking error similar to the Hard Currency Sovereign strategy (3.25%), but achieved a 3.05% annualized excess return, resulting in an information ratio of approximately 0.94. However, it should be noted that around half of this outperformance occurred in 2009, the rebound year following the Global Financial Crisis. Excluding 2009 from the dataset, the Hard Currency Corporate strategy would still have produced over 1.5% annualized excess return, comparable to the other asset classes, and the tracking error would have declined to a relatively modest 2.1%, resulting in an even stronger information ratio. This period, however, serves to underscore the benefits of a systematic tactical approach. For instance, during the significant market drawdown of 2008, the system declined by only 10.9% compared to the benchmark’s loss of 15.9%. More significantly, the model correctly signaled to increase risk exposure during the crisis, achieving a remarkable 33.7% outperformance in 2009 when markets rebounded.
These findings indicate that tactical positioning can add value. Outperformance over benchmarks has been consistent across Emerging Market Debt asset classes over the long term, with a general reduction in volatility relative to indices. Moreover, drawdowns were also consistently reduced. Notably, in periods of pronounced market declines and recoveries, such as the 2008–2009 Global Financial Crisis, the model both limited losses and participated in market rallies across all asset classes.
Summary
Please be advised that the returns referenced above are produced by our proprietary, rules-based model and do not represent the actual performance of our strategies. These promising results suggest potential avenues for further research. For example, in a low-risk regime, the model could be modified to rotate 100% into cash, rather than into lower risk benchmark assets. Alternatively, investors capable of adopting both long and short positions could consider adjusting parameters to shift from 100% long maximum risk to 100% short maximum risk portfolios as another methodological possibility. Refining the size of low and high-risk asset pools might also facilitate implementation of these rotations. In some scenarios, employing derivatives may help reduce friction costs associated with portfolio adjustments. Furthermore, the 30-factor model utilized can be adapted to incorporate different fundamental data sets or technical indicators. The potential for further customization is substantial, allowing investors to tailor research parameters according to individual risk appetites and specific investment guidelines.
In conclusion, while tactical investing entails certain challenges, the prospect of achieving superior returns remains compelling, particularly in less efficient markets such as EMD. For investors prepared to navigate these complexities, evidence from the past two decades suggests that even modest tactical rebalancing, when compared to buy-and-hold strategies, can serve as a valuable instrument for enhancing portfolio performance.
References
Asness, Cliff S., The Less-Efficient Market Hypothesis (2024). The Journal of Portfolio Management. Forthcoming, available at SSRN: https://ssrn.com/abstract=4942046 or http://dx.doi.org/10.2139/ssrn.4942046
Brown, S. J., & Goetzmann, W. N. (1995). Performance Persistence. Journal of Finance, 50(2),679-698.2.
Fama, E.E.., & French, K. R. (2004). "The Capital Asset Pricing Model: Theory and Evidence." Journal of Economic Perspectives, 18 (3): 25–46.
Kahneman, D., & Tversky, A. (1979). Prospect Theory: An Analysis of Decision under Risk. Econometrica, 47(2),263-291.
Sharpe, W. F. (1992). Asset Allocation: Management Style and Performance Measurement. The Journal of Portfolio Management,18(2),5-10.5.
Tsai, H. C., et al. (2021). Behavioral Finance: The Impact of Psychological Factors on Investors’ Decision-Making. Journal of Behavioral Finance, 22(2),191-210.
Disclaimer & Important Disclosures
Global Evolution Asset Management A/S (“Global Evolution DK”) is incorporated in Denmark and authorized and regulated by the Danish FSA (Finanstilsynet). GEAM DK is located at Buen 11, 2nd Floor, Kolding 6000, Denmark.
Global Evolution DK has a United Kingdom branch (“Global Evolution Asset Management A/S (London Branch)”) located at Level 8, 24 Monument Street, London, EC3R 8AJ, United Kingdom. This branch is authorized and regulated by the Financial Conduct Authority under the Firm Reference Number 954331.
In the United States, investment advisory services are offered through Global Evolution USA, LLC (‘Global Evolution USA”), an SEC registered investment advisor. Registration with the SEC does not infer any specific qualifications Global Evolution USA is located at: 250 Park Avenue, 15th floor, New York, NY. Global Evolution USA is an wholly-owned subsidiary of Global Evolution Asset Management A/S (“Global Evolution DK”). Global Evolution DK is exempt from SEC registration as a “participating affiliate” of Global Evolution USA as that term is used in relief granted by the staff of the SEC allowing U.S. registered investment advisers to use investment advisory resources of non-U.S. investment adviser affiliates subject to the regulatory supervision of the U.S. registered investment adviser. Registration with the SEC does not imply any level of skill or expertise. Prior to making any investment, an investor should read all disclosure and other documents associated with such investment including Global Evolution’s Form ADV which can be found at https://adviserinfo.sec.gov.
In Singapore, Global Evolution Fund Management Singapore Pte. Ltd has a Capital Markets Services license issued by the Monetary Authority of Singapore for fund management activities. It is located at Level 39, Marina Bay Financial Centre Tower 2, 10 Marina Boulevard, Singapore 018983.
Global Evolution is affiliated with Conning, Inc., Goodwin Capital Advisers, Inc., Conning Investment Products, Inc., a FINRA-registered broker dealer, Conning Asset Management Limited, Conning Asia Pacific Limited and Octagon Credit Investors, LLC are all direct or indirect subsidiaries of Conning Holdings Limited (collectively, “Conning”) which is one of the family of companies owned by Cathay Financial Holding Co., Ltd., a Taiwan-based company. Conning has offices in Boston, Cologne, Hartford, Hong Kong, London, New York, and Tokyo.
Conning, Inc., Conning Investment Products, Inc., Goodwin Capital Advisers, Inc., Octagon Credit Investors, LLC, are registered with the Securities and Exchange Commission (“SEC”) under the Investment Advisers Act of 1940 and have noticed other jurisdictions they are conducting securities advisory business when required by law. In any other jurisdictions where they have not provided notice and are not exempt or excluded from those laws, they cannot transact business as an investment adviser and may not be able to respond to individual inquiries if the response could potentially lead to a transaction in securities. Conning, Inc. is also registered with the National Futures Association and Korea’s Financial Services Commission. Conning Investment Products, Inc. is also registered with the Ontario Securities Commission. Conning Asset Management Limited is authorised and regulated by the United Kingdom's Financial Conduct Authority (FCA#189316), Conning Asia Pacific Limited is regulated by Hong Kong’s Securities and Futures Commission for Types 1, 4 and 9 regulated activities.
This publication is for informational purposes and is not intended as an offer to purchase any security. Nothing contained in this website constitutes or forms part of any offer to sell or buy an investment, or any solicitation of such an offer in any jurisdiction in which such offer or solicitation would be unlawful.
All investments entail risk and you could lose all or a substantial amount of your investment. Past performance is not indicative of future results which may differ materially from past performance. The strategies presented herein invest in foreign securities which involve volatility and political, economic and currency risks and differences in accounting methods. These risks are greater for investments in emerging and frontier markets. Derivatives may involve certain costs and risks such as liquidity, interest rate, market and credit.
This communication may contain Index data from J.P. Morgan or data derived from such Index data. Index data information has been obtained from sources believed to be reliable but J.P. Morgan does not warrant its completeness or accuracy. The Index is used with permission. The Index may not be copied, used, or distributed without J.P. Morgan's prior written approval. Copyright 2025, J.P. Morgan Chase & Co. All rights reserved.
This communication may contain aggregate peer analysis data has been obtained from eVestment Alliance LLC and its affiliated entities (collectively, "eVestment"). eVestment reserves all rights, including to ownership and distribution. eVestment collects information directly from investment management firms and other sources believed to be reliable; however, eVestment does not guarantee or warrant the accuracy, timeliness, or completeness of the information provided and is not responsible for any errors or omissions. Performance results may be provided with additional disclosures available on eVestment’s systems and other important considerations such as fees that may be applicable. Not for general distribution. * All categories not necessarily included; Totals may not equal 100%. Copyright 2013‐2025 eVestment Alliance, LLC. Returns less than a year are not annualized.
While reasonable care has been taken to ensure that the information herein is factually correct, Global Evolution makes no representation or guarantee as to its accuracy or completeness. The information herein is subject to change without notice. Certain information contained herein has been provided by third party sources which are believed to be reliable, but accuracy and completeness cannot be guaranteed. Global Evolution does not guarantee the accuracy of information obtained from third party/other sources.
The information herein is not intended to provide, and should not be relied upon for, accounting, legal or tax advice or investment recommendations. This document does not constitute investment advice. The contents of this document represent Global Evolution's general views on certain matters, and is not based upon, and does not consider, the specific circumstance of any investor.
Legal Disclaimer ©2025 Global Evolution.
This document is copyrighted with all rights reserved. No part of this document may be distributed, reproduced, transcribed, transmitted, stored in an electronic retrieval system, or translated into any language in any form by any means without the prior written permission of Global Evolution, as applicable.
For Appendix 1 - Monthly Returns for each Regime Strategy and its corresponding benchmark please download research note.
Copyright © 2026 Global Evolution - All rights reserved